InternationalGeneral IGIC full analysis,charts,indicators,moving averages,SMA,DMA,EMA,ADX,MACD,RSIInternational General IGIC WideScreen charts, DMA,SMA,EMA technical analysis, forecast prediction, by indicators ADX,MACD,RSI,CCI NASDAQ stock exchange
Daily price and charts and targets InternationalGeneral Strong Daily Stock price targets for InternationalGeneral IGIC are 23.48 and 24.17 | Daily Target 1 | 23.36 | | Daily Target 2 | 23.6 | | Daily Target 3 | 24.05 | | Daily Target 4 | 24.29 | | Daily Target 5 | 24.74 |
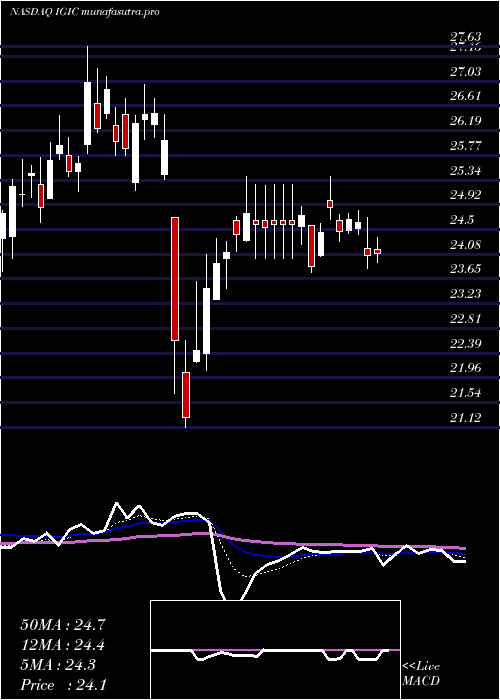
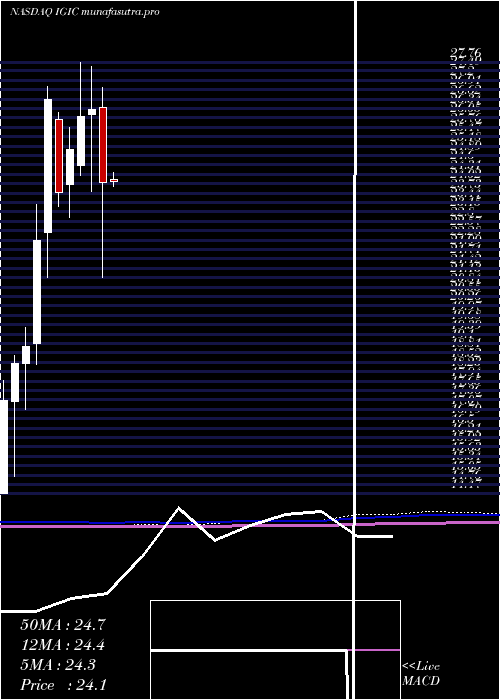
Daily price and volume International General
| Date |
Closing |
Open |
Range |
Volume |
Mon 14 July 2025 |
23.84 (-1.37%) |
24.07 |
23.81 - 24.50 |
1.3248 times |
Fri 11 July 2025 |
24.17 (0.29%) |
24.03 |
24.03 - 24.50 |
0.9503 times |
Thu 10 July 2025 |
24.10 (-0.54%) |
24.16 |
24.02 - 24.46 |
0.7499 times |
Wed 09 July 2025 |
24.23 (1.13%) |
24.12 |
24.00 - 24.35 |
0.5374 times |
Tue 08 July 2025 |
23.96 (0.34%) |
23.95 |
23.68 - 24.08 |
0.6649 times |
Mon 07 July 2025 |
23.88 (-0.33%) |
23.86 |
23.65 - 24.04 |
1.3045 times |
Thu 03 July 2025 |
23.96 (1.44%) |
23.72 |
23.63 - 24.24 |
0.5708 times |
Wed 02 July 2025 |
23.62 (0.9%) |
23.53 |
23.21 - 23.75 |
1.4229 times |
Tue 01 July 2025 |
23.41 (-2.54%) |
23.95 |
23.38 - 23.95 |
1.595 times |
Mon 30 June 2025 |
24.02 (-0.12%) |
24.14 |
23.93 - 24.30 |
0.8795 times |
Fri 27 June 2025 |
24.05 (1.52%) |
23.65 |
23.55 - 24.12 |
1.2458 times |
Weekly price and charts InternationalGeneral Strong weekly Stock price targets for InternationalGeneral IGIC are 23.48 and 24.17 | Weekly Target 1 | 23.36 | | Weekly Target 2 | 23.6 | | Weekly Target 3 | 24.05 | | Weekly Target 4 | 24.29 | | Weekly Target 5 | 24.74 |
Weekly price and volumes for International General
| Date |
Closing |
Open |
Range |
Volume |
Mon 14 July 2025 |
23.84 (-1.37%) |
24.07 |
23.81 - 24.50 |
0.2235 times |
Fri 11 July 2025 |
24.17 (0.88%) |
23.86 |
23.65 - 24.50 |
0.7098 times |
Thu 03 July 2025 |
23.96 (-0.37%) |
24.14 |
23.21 - 24.30 |
0.7539 times |
Fri 27 June 2025 |
24.05 (9.32%) |
22.00 |
21.93 - 24.12 |
1.7504 times |
Fri 20 June 2025 |
22.00 (-4.93%) |
23.41 |
21.91 - 23.57 |
1.0046 times |
Fri 13 June 2025 |
23.14 (0.09%) |
23.22 |
22.57 - 23.68 |
1.1769 times |
Fri 06 June 2025 |
23.12 (-0.94%) |
23.29 |
22.57 - 23.39 |
1.0672 times |
Fri 30 May 2025 |
23.34 (1.08%) |
23.21 |
22.85 - 23.67 |
0.7884 times |
Fri 23 May 2025 |
23.09 (-4.15%) |
23.88 |
22.79 - 24.09 |
1.0047 times |
Fri 16 May 2025 |
24.09 (4.65%) |
23.31 |
22.78 - 24.43 |
1.5206 times |
Fri 09 May 2025 |
23.02 (-9.9%) |
25.33 |
22.87 - 26.40 |
1.5966 times |

Monthly price and charts InternationalGeneral Strong monthly Stock price targets for InternationalGeneral IGIC are 22.88 and 24.17 | Monthly Target 1 | 22.56 | | Monthly Target 2 | 23.2 | | Monthly Target 3 | 23.85 | | Monthly Target 4 | 24.49 | | Monthly Target 5 | 25.14 |
Monthly price and volumes International General
| Date |
Closing |
Open |
Range |
Volume |
Mon 14 July 2025 |
23.84 (-0.75%) |
23.95 |
23.21 - 24.50 |
0.3963 times |
Mon 30 June 2025 |
24.02 (2.91%) |
23.29 |
21.91 - 24.30 |
1.3257 times |
Fri 30 May 2025 |
23.34 (-2.99%) |
24.16 |
22.78 - 26.40 |
1.3672 times |
Wed 30 April 2025 |
24.06 (-8.55%) |
26.38 |
21.12 - 26.98 |
1.3982 times |
Mon 31 March 2025 |
26.31 (0.84%) |
26.16 |
23.78 - 27.63 |
0.6819 times |
Fri 28 February 2025 |
26.09 (4.07%) |
24.58 |
24.28 - 27.76 |
0.7291 times |
Fri 31 January 2025 |
25.07 (5.51%) |
23.99 |
22.97 - 25.74 |
0.7949 times |
Tue 31 December 2024 |
23.76 (-10.68%) |
26.01 |
23.33 - 26.20 |
0.7031 times |
Tue 26 November 2024 |
26.60 (19.44%) |
22.52 |
21.14 - 27.00 |
1.4071 times |
Thu 31 October 2024 |
22.27 (17.21%) |
19.09 |
18.45 - 23.38 |
1.1964 times |
Mon 30 September 2024 |
19.00 (2.81%) |
18.49 |
17.06 - 19.60 |
0.5145 times |
DMA SMA EMA moving averages of International General IGIC
DMA (daily moving average) of International General IGIC
| DMA period | DMA value | | 5 day DMA | 24.06 | | 12 day DMA | 23.91 | | 20 day DMA | 23.51 | | 35 day DMA | 23.29 | | 50 day DMA | 23.52 | | 100 day DMA | 24.33 | | 150 day DMA | 24.43 | | 200 day DMA | 23.64 | EMA (exponential moving average) of International General IGIC
| EMA period | EMA current | EMA prev | EMA prev2 | | 5 day EMA | 23.99 | 24.06 | 24.01 | | 12 day EMA | 23.81 | 23.81 | 23.75 | | 20 day EMA | 23.67 | 23.65 | 23.6 | | 35 day EMA | 23.68 | 23.67 | 23.64 | | 50 day EMA | 23.67 | 23.66 | 23.64 |
SMA (simple moving average) of International General IGIC
| SMA period | SMA current | SMA prev | SMA prev2 | | 5 day SMA | 24.06 | 24.07 | 24.03 | | 12 day SMA | 23.91 | 23.85 | 23.78 | | 20 day SMA | 23.51 | 23.45 | 23.39 | | 35 day SMA | 23.29 | 23.29 | 23.28 | | 50 day SMA | 23.52 | 23.54 | 23.55 | | 100 day SMA | 24.33 | 24.36 | 24.39 | | 150 day SMA | 24.43 | 24.45 | 24.46 | | 200 day SMA | 23.64 | 23.61 | 23.58 |
|
|
