InterdigitalInc IDCC full analysis,charts,indicators,moving averages,SMA,DMA,EMA,ADX,MACD,RSIInterdigital Inc IDCC WideScreen charts, DMA,SMA,EMA technical analysis, forecast prediction, by indicators ADX,MACD,RSI,CCI NASDAQ stock exchange
operates under Miscellaneous sector & deals in Multi Sector Companies
Daily price and charts and targets InterdigitalInc Strong Daily Stock price targets for InterdigitalInc IDCC are 352.31 and 358.73 | Daily Target 1 | 347.07 | | Daily Target 2 | 351.12 | | Daily Target 3 | 353.48666666667 | | Daily Target 4 | 357.54 | | Daily Target 5 | 359.91 |
Daily price and volume Interdigital Inc
| Date |
Closing |
Open |
Range |
Volume |
Fri 05 December 2025 |
355.18 (1.25%) |
350.79 |
349.43 - 355.85 |
0.6769 times |
Thu 04 December 2025 |
350.79 (2.62%) |
340.24 |
339.87 - 354.86 |
0.9178 times |
Wed 03 December 2025 |
341.84 (1.21%) |
335.68 |
332.81 - 342.69 |
1.1876 times |
Tue 02 December 2025 |
337.74 (-3.96%) |
352.81 |
329.75 - 355.93 |
1.5056 times |
Mon 01 December 2025 |
351.66 (-1.7%) |
350.38 |
345.51 - 356.14 |
0.6967 times |
Fri 28 November 2025 |
357.75 (-0.59%) |
363.98 |
354.00 - 363.98 |
0.4411 times |
Wed 26 November 2025 |
359.89 (0.65%) |
356.74 |
355.12 - 365.61 |
1.1477 times |
Tue 25 November 2025 |
357.57 (3.45%) |
346.62 |
343.82 - 361.53 |
1.1625 times |
Mon 24 November 2025 |
345.64 (5.5%) |
330.54 |
330.54 - 347.60 |
1.052 times |
Fri 21 November 2025 |
327.63 (0.08%) |
325.61 |
322.75 - 332.29 |
1.212 times |
Thu 20 November 2025 |
327.37 (-2.64%) |
344.76 |
326.31 - 345.46 |
1.4571 times |
Weekly price and charts InterdigitalInc Strong weekly Stock price targets for InterdigitalInc IDCC are 342.47 and 368.86 | Weekly Target 1 | 320.63 | | Weekly Target 2 | 337.91 | | Weekly Target 3 | 347.02333333333 | | Weekly Target 4 | 364.3 | | Weekly Target 5 | 373.41 |
Weekly price and volumes for Interdigital Inc
| Date |
Closing |
Open |
Range |
Volume |
Fri 05 December 2025 |
355.18 (-0.72%) |
350.38 |
329.75 - 356.14 |
1.0919 times |
Fri 28 November 2025 |
357.75 (9.19%) |
330.54 |
330.54 - 365.61 |
0.8331 times |
Fri 21 November 2025 |
327.63 (-5.97%) |
347.95 |
322.75 - 352.28 |
1.0773 times |
Fri 14 November 2025 |
348.44 (-5.84%) |
370.07 |
338.89 - 376.40 |
0.934 times |
Fri 07 November 2025 |
370.07 (2.24%) |
381.58 |
366.91 - 393.94 |
0.9679 times |
Fri 31 October 2025 |
361.96 (0%) |
395.63 |
352.95 - 396.37 |
0.5923 times |
Fri 31 October 2025 |
361.96 (-4.37%) |
391.94 |
352.95 - 412.60 |
1.8877 times |
Fri 24 October 2025 |
378.51 (3.18%) |
370.17 |
353.83 - 384.34 |
0.7852 times |
Fri 17 October 2025 |
366.85 (7.93%) |
343.37 |
343.37 - 369.58 |
0.7826 times |
Fri 10 October 2025 |
339.90 (0.24%) |
338.08 |
331.16 - 353.61 |
1.0481 times |
Fri 03 October 2025 |
339.10 (-1.72%) |
348.57 |
337.50 - 361.56 |
1.9657 times |
Monthly price and charts InterdigitalInc Strong monthly Stock price targets for InterdigitalInc IDCC are 342.47 and 368.86 | Monthly Target 1 | 320.63 | | Monthly Target 2 | 337.91 | | Monthly Target 3 | 347.02333333333 | | Monthly Target 4 | 364.3 | | Monthly Target 5 | 373.41 |
Monthly price and volumes Interdigital Inc
| Date |
Closing |
Open |
Range |
Volume |
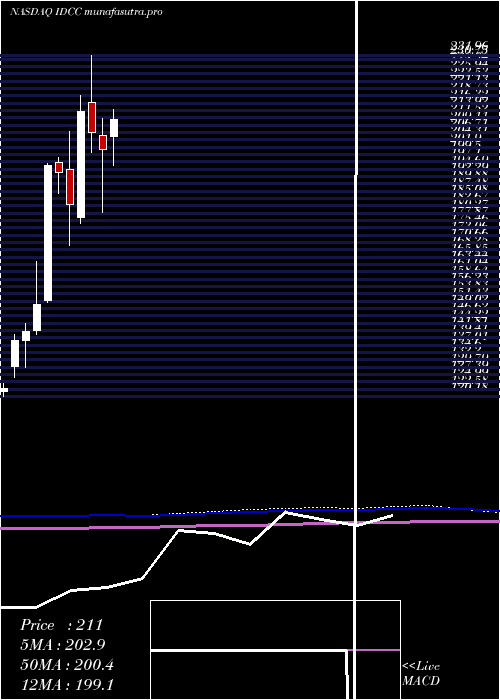
Fri 05 December 2025 |
355.18 (-0.72%) |
350.38 |
329.75 - 356.14 |
0.2444 times |
Fri 28 November 2025 |
357.75 (-1.16%) |
381.58 |
322.75 - 393.94 |
0.8533 times |
Fri 31 October 2025 |
361.96 (4.85%) |
344.99 |
331.16 - 412.60 |
1.4939 times |
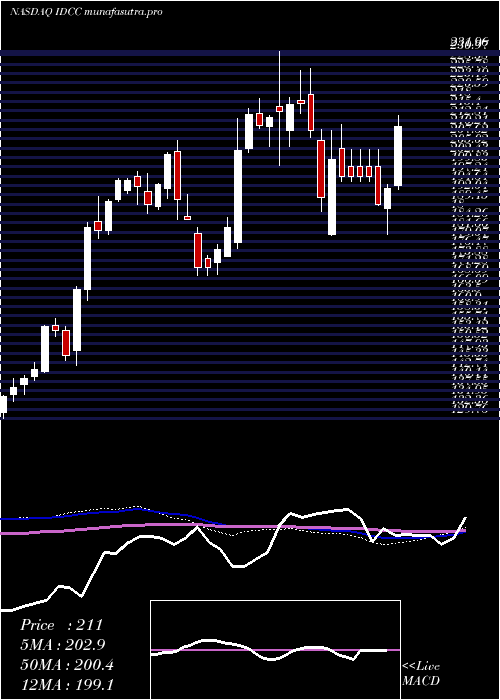
Tue 30 September 2025 |
345.23 (27.06%) |
268.43 |
265.14 - 360.30 |
1.4065 times |
Fri 29 August 2025 |
271.71 (5.23%) |
252.75 |
247.66 - 276.88 |
0.8888 times |
Thu 31 July 2025 |
258.20 (15.15%) |
223.20 |
213.06 - 277.95 |
0.9831 times |
Mon 30 June 2025 |
224.23 (3.21%) |
217.21 |
213.01 - 237.50 |
0.7734 times |
Fri 30 May 2025 |
217.26 (8.09%) |
205.26 |
196.00 - 224.80 |
0.9972 times |
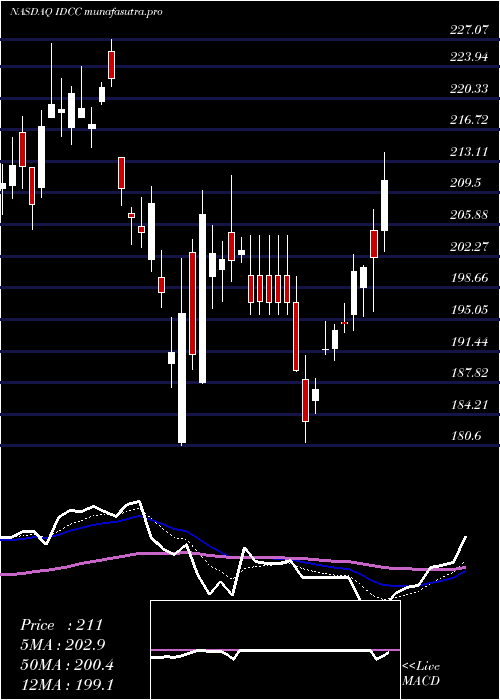
Wed 30 April 2025 |
201.00 (-2.78%) |
205.67 |
180.60 - 211.45 |
1.0999 times |
Mon 31 March 2025 |
206.75 (-3.23%) |
216.66 |
200.13 - 231.96 |
1.2596 times |
Fri 28 February 2025 |
213.64 (16.76%) |
178.80 |
177.00 - 218.76 |
1.2884 times |
DMA SMA EMA moving averages of Interdigital Inc IDCC
DMA (daily moving average) of Interdigital Inc IDCC
| DMA period | DMA value | | 5 day DMA | 347.44 | | 12 day DMA | 345.78 | | 20 day DMA | 349 | | 35 day DMA | 360.49 | | 50 day DMA | 357.27 | | 100 day DMA | 317.3 | | 150 day DMA | 285.26 | | 200 day DMA | 265.23 | EMA (exponential moving average) of Interdigital Inc IDCC
| EMA period | EMA current | EMA prev | EMA prev2 | | 5 day EMA | 349.9 | 347.26 | 345.49 | | 12 day EMA | 349.33 | 348.27 | 347.81 | | 20 day EMA | 351.17 | 350.75 | 350.75 | | 35 day EMA | 352 | 351.81 | 351.87 | | 50 day EMA | 355.17 | 355.17 | 355.35 |
SMA (simple moving average) of Interdigital Inc IDCC
| SMA period | SMA current | SMA prev | SMA prev2 | | 5 day SMA | 347.44 | 347.96 | 349.78 | | 12 day SMA | 345.78 | 344.17 | 343.2 | | 20 day SMA | 349 | 350.28 | 352.03 | | 35 day SMA | 360.49 | 360.84 | 361.24 | | 50 day SMA | 357.27 | 356.95 | 356.85 | | 100 day SMA | 317.3 | 316.04 | 314.79 | | 150 day SMA | 285.26 | 284.23 | 283.24 | | 200 day SMA | 265.23 | 264.54 | 263.87 |
|
|
