IconPlc ICLR full analysis,charts,indicators,moving averages,SMA,DMA,EMA,ADX,MACD,RSIIcon Plc ICLR WideScreen charts, DMA,SMA,EMA technical analysis, forecast prediction, by indicators ADX,MACD,RSI,CCI NASDAQ stock exchange
operates under Health Care sector & deals in Biotechnology Commercial Physical Biological Resarch
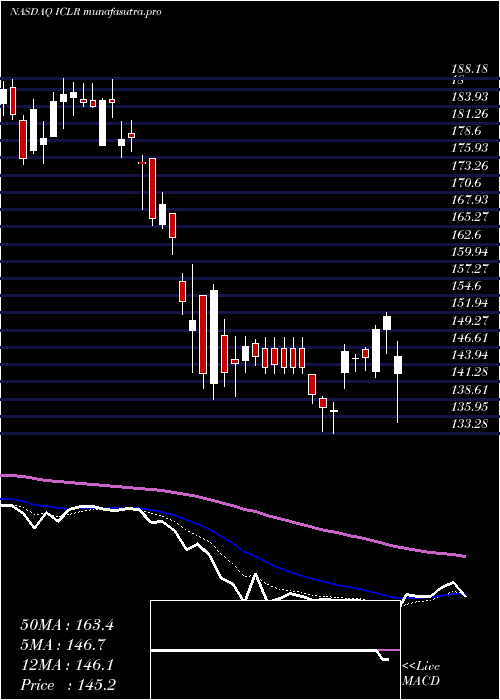
Daily price and charts and targets IconPlc Strong Daily Stock price targets for IconPlc ICLR are 149.28 and 152.54 | Daily Target 1 | 146.69 | | Daily Target 2 | 148.6 | | Daily Target 3 | 149.94666666667 | | Daily Target 4 | 151.86 | | Daily Target 5 | 153.21 |
Daily price and volume Icon Plc
| Date |
Closing |
Open |
Range |
Volume |
Fri 11 July 2025 |
150.52 (-1.02%) |
148.98 |
148.03 - 151.29 |
0.9757 times |
Thu 10 July 2025 |
152.07 (1.02%) |
150.79 |
149.89 - 155.90 |
1.4637 times |
Wed 09 July 2025 |
150.53 (-0.69%) |
152.85 |
148.59 - 155.38 |
0.837 times |
Tue 08 July 2025 |
151.58 (2.7%) |
148.12 |
148.12 - 153.06 |
1.0446 times |
Mon 07 July 2025 |
147.59 (-1.67%) |
150.24 |
146.56 - 150.24 |
1.1037 times |
Thu 03 July 2025 |
150.10 (-0.48%) |
152.23 |
149.57 - 154.05 |
0.4702 times |
Wed 02 July 2025 |
150.82 (1.3%) |
147.28 |
146.35 - 151.39 |
0.6344 times |
Tue 01 July 2025 |
148.88 (2.36%) |
144.87 |
144.29 - 155.25 |
1.1686 times |
Mon 30 June 2025 |
145.45 (0.62%) |
144.78 |
142.89 - 146.34 |
1.1292 times |
Fri 27 June 2025 |
144.56 (-1.49%) |
147.29 |
143.92 - 147.75 |
1.1729 times |
Thu 26 June 2025 |
146.75 (0.58%) |
147.61 |
145.02 - 148.39 |
1.1217 times |
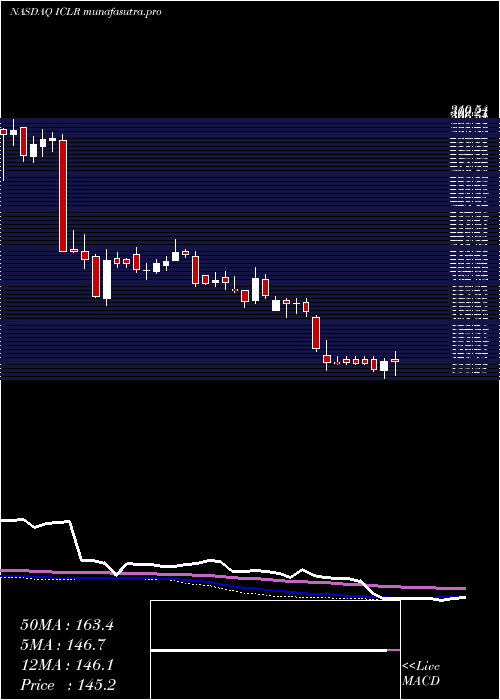
Weekly price and charts IconPlc Strong weekly Stock price targets for IconPlc ICLR are 148.54 and 157.88 | Weekly Target 1 | 141.65 | | Weekly Target 2 | 146.09 | | Weekly Target 3 | 150.99333333333 | | Weekly Target 4 | 155.43 | | Weekly Target 5 | 160.33 |
Weekly price and volumes for Icon Plc
| Date |
Closing |
Open |
Range |
Volume |
Fri 11 July 2025 |
150.52 (0.28%) |
150.24 |
146.56 - 155.90 |
0.9194 times |
Thu 03 July 2025 |
150.10 (3.83%) |
144.78 |
142.89 - 155.25 |
0.5767 times |
Fri 27 June 2025 |
144.56 (-1.31%) |
145.75 |
143.92 - 149.68 |
1.092 times |
Fri 20 June 2025 |
146.48 (0.56%) |
144.80 |
140.20 - 147.50 |
0.6502 times |
Fri 13 June 2025 |
145.66 (4.71%) |
140.67 |
138.59 - 150.00 |
0.968 times |
Fri 06 June 2025 |
139.11 (6.78%) |
130.14 |
126.14 - 142.99 |
0.9653 times |
Fri 30 May 2025 |
130.28 (1.79%) |
129.00 |
127.96 - 133.07 |
0.7911 times |
Fri 23 May 2025 |
127.99 (-2.77%) |
128.03 |
125.10 - 134.44 |
1.0778 times |
Fri 16 May 2025 |
131.63 (-1.74%) |
137.23 |
129.25 - 142.58 |
1.3231 times |
Fri 09 May 2025 |
133.96 (-6.3%) |
144.22 |
133.86 - 145.00 |
1.6362 times |
Fri 02 May 2025 |
142.96 (-1.38%) |
146.29 |
135.00 - 151.99 |
2.2766 times |
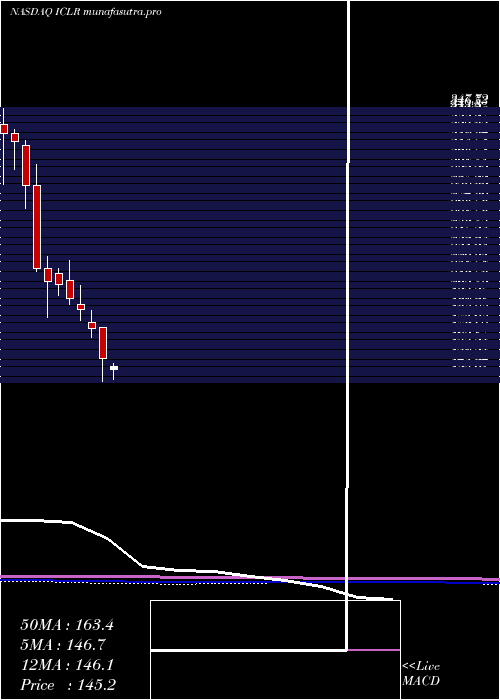
Monthly price and charts IconPlc Strong monthly Stock price targets for IconPlc ICLR are 147.41 and 159.02 | Monthly Target 1 | 138.63 | | Monthly Target 2 | 144.57 | | Monthly Target 3 | 150.23666666667 | | Monthly Target 4 | 156.18 | | Monthly Target 5 | 161.85 |
Monthly price and volumes Icon Plc
| Date |
Closing |
Open |
Range |
Volume |
Fri 11 July 2025 |
150.52 (3.49%) |
144.87 |
144.29 - 155.90 |
0.3376 times |
Mon 30 June 2025 |
145.45 (11.64%) |
130.14 |
126.14 - 150.00 |
1.0005 times |
Fri 30 May 2025 |
130.28 (-13.97%) |
142.60 |
125.10 - 151.99 |
1.5164 times |
Wed 30 April 2025 |
151.44 (-13.46%) |
175.88 |
133.28 - 175.88 |
1.4362 times |
Mon 31 March 2025 |
174.99 (-7.91%) |
179.50 |
168.00 - 189.18 |
0.7814 times |
Fri 28 February 2025 |
190.02 (-4.55%) |
194.19 |
181.51 - 208.95 |
0.799 times |
Fri 31 January 2025 |
199.08 (-5.07%) |
212.52 |
194.33 - 228.29 |
0.9174 times |
Tue 31 December 2024 |
209.71 (-1.15%) |
218.21 |
200.69 - 222.58 |
0.5899 times |
Tue 26 November 2024 |
212.15 (-4.48%) |
222.44 |
183.38 - 231.89 |
1.3901 times |
Thu 31 October 2024 |
222.11 (-22.69%) |
287.31 |
220.01 - 303.69 |
1.2314 times |
Mon 30 September 2024 |
287.31 (-10.79%) |
319.05 |
269.09 - 323.25 |
0.6556 times |
DMA SMA EMA moving averages of Icon Plc ICLR
DMA (daily moving average) of Icon Plc ICLR
| DMA period | DMA value | | 5 day DMA | 150.46 | | 12 day DMA | 148.73 | | 20 day DMA | 147.54 | | 35 day DMA | 141.39 | | 50 day DMA | 140.66 | | 100 day DMA | 155.11 | | 150 day DMA | 171.7 | | 200 day DMA | 192.86 | EMA (exponential moving average) of Icon Plc ICLR
| EMA period | EMA current | EMA prev | EMA prev2 | | 5 day EMA | 150.55 | 150.56 | 149.81 | | 12 day EMA | 148.94 | 148.65 | 148.03 | | 20 day EMA | 147.04 | 146.67 | 146.1 | | 35 day EMA | 144.63 | 144.28 | 143.82 | | 50 day EMA | 141.75 | 141.39 | 140.95 |
SMA (simple moving average) of Icon Plc ICLR
| SMA period | SMA current | SMA prev | SMA prev2 | | 5 day SMA | 150.46 | 150.37 | 150.12 | | 12 day SMA | 148.73 | 148.57 | 148.17 | | 20 day SMA | 147.54 | 147.25 | 146.63 | | 35 day SMA | 141.39 | 140.83 | 140.24 | | 50 day SMA | 140.66 | 140.55 | 140.41 | | 100 day SMA | 155.11 | 155.47 | 155.77 | | 150 day SMA | 171.7 | 172.14 | 172.55 | | 200 day SMA | 192.86 | 193.59 | 194.33 |
|
|
