IcfInternational ICFI full analysis,charts,indicators,moving averages,SMA,DMA,EMA,ADX,MACD,RSIIcf International ICFI WideScreen charts, DMA,SMA,EMA technical analysis, forecast prediction, by indicators ADX,MACD,RSI,CCI NASDAQ stock exchange
operates under Consumer Services sector & deals in Professional Services
Daily price and charts and targets IcfInternational Strong Daily Stock price targets for IcfInternational ICFI are 84.22 and 86.05 | Daily Target 1 | 82.71 | | Daily Target 2 | 83.89 | | Daily Target 3 | 84.543333333333 | | Daily Target 4 | 85.72 | | Daily Target 5 | 86.37 |
Daily price and volume Icf International
| Date |
Closing |
Open |
Range |
Volume |
Fri 05 December 2025 |
85.06 (-0.36%) |
84.61 |
83.37 - 85.20 |
0.8343 times |
Thu 04 December 2025 |
85.37 (2.11%) |
84.01 |
84.01 - 86.85 |
1.1937 times |
Wed 03 December 2025 |
83.61 (2.45%) |
81.18 |
81.15 - 83.65 |
0.8744 times |
Tue 02 December 2025 |
81.61 (4.8%) |
79.73 |
78.79 - 82.90 |
1.5053 times |
Mon 01 December 2025 |
77.87 (-0.22%) |
77.83 |
76.79 - 78.87 |
0.9722 times |
Fri 28 November 2025 |
78.04 (-1.19%) |
78.82 |
77.80 - 79.18 |
0.6769 times |
Wed 26 November 2025 |
78.98 (0.7%) |
78.24 |
77.84 - 79.23 |
0.9152 times |
Tue 25 November 2025 |
78.43 (2.3%) |
77.27 |
77.11 - 79.39 |
1.1724 times |
Mon 24 November 2025 |
76.67 (-1.73%) |
77.95 |
75.75 - 78.00 |
0.9515 times |
Fri 21 November 2025 |
78.02 (2%) |
76.61 |
76.45 - 78.74 |
0.9042 times |
Thu 20 November 2025 |
76.49 (0.01%) |
76.80 |
75.55 - 77.58 |
1.2689 times |
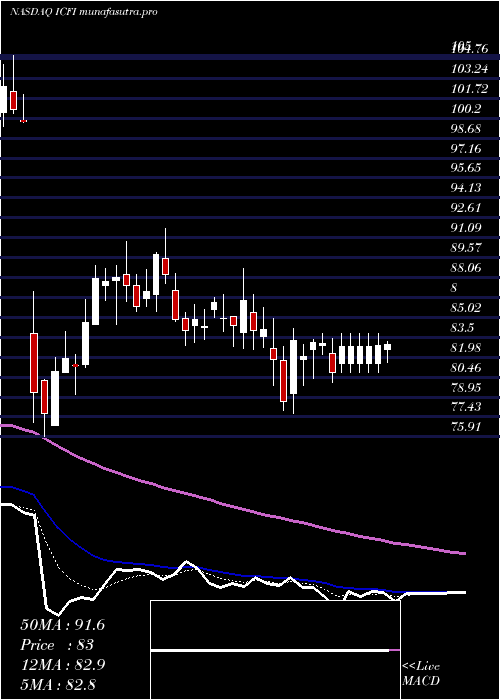
Weekly price and charts IcfInternational Strong weekly Stock price targets for IcfInternational ICFI are 80.93 and 90.99 | Weekly Target 1 | 72.84 | | Weekly Target 2 | 78.95 | | Weekly Target 3 | 82.9 | | Weekly Target 4 | 89.01 | | Weekly Target 5 | 92.96 |
Weekly price and volumes for Icf International
| Date |
Closing |
Open |
Range |
Volume |
Fri 05 December 2025 |
85.06 (9%) |
77.83 |
76.79 - 86.85 |
0.9811 times |
Fri 28 November 2025 |
78.04 (0.03%) |
77.95 |
75.75 - 79.39 |
0.6777 times |
Fri 21 November 2025 |
78.02 (-0.04%) |
77.91 |
75.55 - 78.87 |
1.0149 times |
Fri 14 November 2025 |
78.05 (-4.6%) |
81.91 |
76.62 - 84.20 |
1.0777 times |
Fri 07 November 2025 |
81.81 (1.91%) |
79.11 |
79.01 - 83.61 |
1.1824 times |
Fri 31 October 2025 |
80.28 (0%) |
77.47 |
72.03 - 81.61 |
0.5919 times |
Fri 31 October 2025 |
80.28 (-10.91%) |
90.06 |
72.03 - 90.06 |
1.7014 times |
Fri 24 October 2025 |
90.11 (2.2%) |
88.17 |
86.49 - 91.61 |
0.7523 times |
Fri 17 October 2025 |
88.17 (1.88%) |
86.80 |
85.31 - 88.55 |
1.0956 times |
Fri 10 October 2025 |
86.54 (-8.08%) |
94.24 |
86.20 - 95.28 |
0.9249 times |
Fri 03 October 2025 |
94.15 (1.19%) |
93.22 |
91.84 - 95.66 |
0.7754 times |
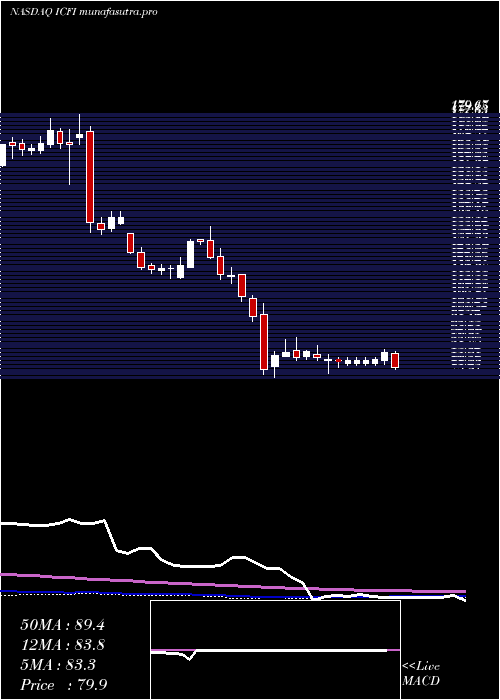
Monthly price and charts IcfInternational Strong monthly Stock price targets for IcfInternational ICFI are 80.93 and 90.99 | Monthly Target 1 | 72.84 | | Monthly Target 2 | 78.95 | | Monthly Target 3 | 82.9 | | Monthly Target 4 | 89.01 | | Monthly Target 5 | 92.96 |
Monthly price and volumes Icf International
| Date |
Closing |
Open |
Range |
Volume |
Fri 05 December 2025 |
85.06 (9%) |
77.83 |
76.79 - 86.85 |
0.2125 times |
Fri 28 November 2025 |
78.04 (-2.79%) |
79.11 |
75.55 - 84.20 |
0.856 times |
Fri 31 October 2025 |
80.28 (-13.49%) |
92.92 |
72.03 - 95.66 |
1.1754 times |
Tue 30 September 2025 |
92.80 (-5.52%) |
97.81 |
90.56 - 101.50 |
0.9844 times |
Fri 29 August 2025 |
98.22 (17.08%) |
89.99 |
85.01 - 101.71 |
1.0979 times |
Thu 31 July 2025 |
83.89 (-0.97%) |
84.61 |
81.95 - 90.54 |
0.8013 times |
Mon 30 June 2025 |
84.71 (-1.41%) |
85.47 |
81.45 - 89.14 |
0.8576 times |
Fri 30 May 2025 |
85.92 (1.13%) |
84.55 |
79.15 - 89.50 |
1.1555 times |
Wed 30 April 2025 |
84.96 (-0.01%) |
85.08 |
77.71 - 88.77 |
1.2489 times |
Mon 31 March 2025 |
84.97 (7.2%) |
80.18 |
75.91 - 91.84 |
1.6106 times |
Fri 28 February 2025 |
79.26 (-32.09%) |
115.91 |
77.02 - 119.48 |
1.9471 times |

DMA SMA EMA moving averages of Icf International ICFI
DMA (daily moving average) of Icf International ICFI
| DMA period | DMA value | | 5 day DMA | 82.7 | | 12 day DMA | 79.72 | | 20 day DMA | 79.59 | | 35 day DMA | 82.44 | | 50 day DMA | 84.96 | | 100 day DMA | 89.45 | | 150 day DMA | 88.22 | | 200 day DMA | 87.61 | EMA (exponential moving average) of Icf International ICFI
| EMA period | EMA current | EMA prev | EMA prev2 | | 5 day EMA | 83.18 | 82.24 | 80.67 | | 12 day EMA | 81.23 | 80.53 | 79.65 | | 20 day EMA | 81.19 | 80.78 | 80.3 | | 35 day EMA | 82.97 | 82.85 | 82.7 | | 50 day EMA | 85.54 | 85.56 | 85.57 |
SMA (simple moving average) of Icf International ICFI
| SMA period | SMA current | SMA prev | SMA prev2 | | 5 day SMA | 82.7 | 81.3 | 80.02 | | 12 day SMA | 79.72 | 79.06 | 78.34 | | 20 day SMA | 79.59 | 79.41 | 79.3 | | 35 day SMA | 82.44 | 82.48 | 82.51 | | 50 day SMA | 84.96 | 85.1 | 85.29 | | 100 day SMA | 89.45 | 89.44 | 89.43 | | 150 day SMA | 88.22 | 88.22 | 88.22 | | 200 day SMA | 87.61 | 87.69 | 87.77 |
|
|
