IacInteractivecorp IAC full analysis,charts,indicators,moving averages,SMA,DMA,EMA,ADX,MACD,RSIIac Interactivecorp IAC WideScreen charts, DMA,SMA,EMA technical analysis, forecast prediction, by indicators ADX,MACD,RSI,CCI NASDAQ stock exchange
operates under Consumer Services sector & deals in Other Specialty Stores
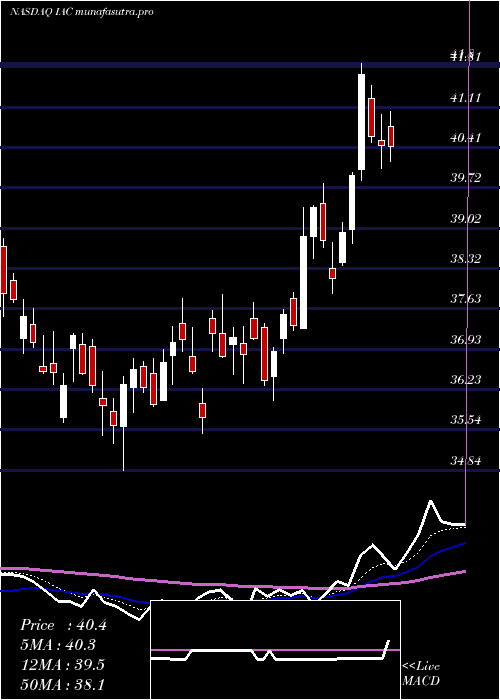
Daily price and charts and targets IacInteractivecorp Strong Daily Stock price targets for IacInteractivecorp IAC are 38.76 and 40 | Daily Target 1 | 38.53 | | Daily Target 2 | 38.99 | | Daily Target 3 | 39.77 | | Daily Target 4 | 40.23 | | Daily Target 5 | 41.01 |
Daily price and volume Iac Interactivecorp
| Date |
Closing |
Open |
Range |
Volume |
Tue 29 July 2025 |
39.45 (-2.21%) |
40.28 |
39.31 - 40.55 |
1.0563 times |
Mon 28 July 2025 |
40.34 (-0.76%) |
40.70 |
40.29 - 40.98 |
0.9732 times |
Fri 25 July 2025 |
40.65 (0.22%) |
40.71 |
40.10 - 40.82 |
1.4379 times |
Thu 24 July 2025 |
40.56 (-1.41%) |
40.90 |
40.51 - 41.26 |
1.5636 times |
Wed 23 July 2025 |
41.14 (0.05%) |
41.19 |
40.86 - 41.47 |
0.8093 times |
Tue 22 July 2025 |
41.12 (0.86%) |
40.68 |
40.58 - 41.40 |
1.0808 times |
Mon 21 July 2025 |
40.77 (0.02%) |
40.80 |
40.43 - 41.29 |
0.8555 times |
Fri 18 July 2025 |
40.76 (-0.54%) |
41.30 |
40.68 - 41.39 |
0.6614 times |
Thu 17 July 2025 |
40.98 (1.29%) |
40.62 |
40.62 - 41.31 |
0.7904 times |
Wed 16 July 2025 |
40.46 (0.07%) |
40.71 |
40.12 - 40.92 |
0.7716 times |
Tue 15 July 2025 |
40.43 (-0.05%) |
40.78 |
40.17 - 41.03 |
0.803 times |
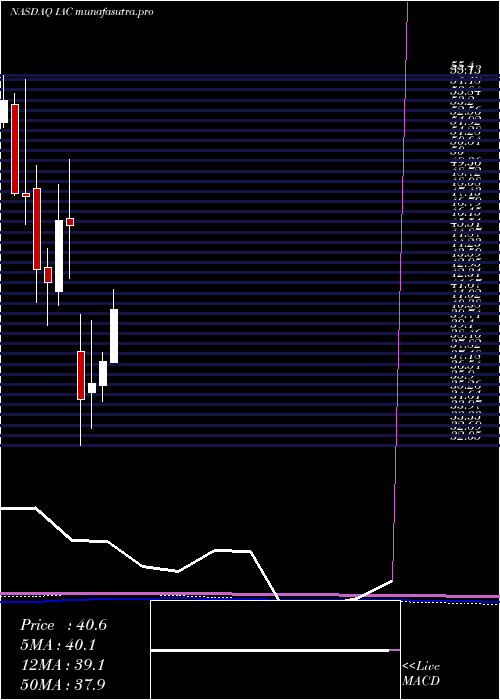
Weekly price and charts IacInteractivecorp Strong weekly Stock price targets for IacInteractivecorp IAC are 38.55 and 40.22 | Weekly Target 1 | 38.24 | | Weekly Target 2 | 38.85 | | Weekly Target 3 | 39.913333333333 | | Weekly Target 4 | 40.52 | | Weekly Target 5 | 41.58 |
Weekly price and volumes for Iac Interactivecorp
| Date |
Closing |
Open |
Range |
Volume |
Tue 29 July 2025 |
39.45 (-2.95%) |
40.70 |
39.31 - 40.98 |
0.3816 times |
Fri 25 July 2025 |
40.65 (-0.27%) |
40.80 |
40.10 - 41.47 |
1.0806 times |
Fri 18 July 2025 |
40.76 (0.39%) |
40.53 |
40.06 - 41.39 |
0.7345 times |
Fri 11 July 2025 |
40.60 (4.61%) |
38.33 |
37.89 - 41.86 |
0.9751 times |
Thu 03 July 2025 |
38.81 (3.38%) |
37.81 |
37.26 - 39.79 |
0.7683 times |
Fri 27 June 2025 |
37.54 (1.08%) |
37.02 |
36.04 - 37.74 |
1.34 times |
Fri 20 June 2025 |
37.14 (3.89%) |
37.47 |
36.49 - 37.88 |
1.226 times |
Fri 13 June 2025 |
35.75 (-0.64%) |
36.04 |
35.48 - 37.81 |
1.1684 times |
Fri 06 June 2025 |
35.98 (0.06%) |
35.85 |
34.84 - 36.78 |
1.2885 times |
Fri 30 May 2025 |
35.96 (-0.96%) |
36.95 |
35.45 - 37.21 |
1.0372 times |
Fri 23 May 2025 |
36.31 (-3.94%) |
37.11 |
35.66 - 37.79 |
1.318 times |
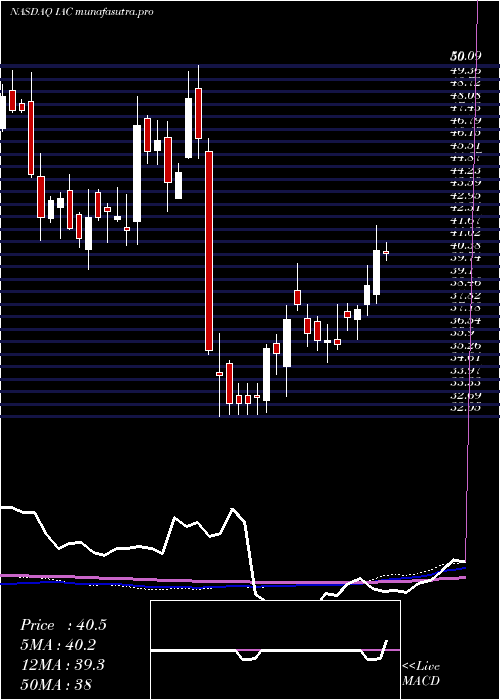
Monthly price and charts IacInteractivecorp Strong monthly Stock price targets for IacInteractivecorp IAC are 38.37 and 42.94 | Monthly Target 1 | 34.96 | | Monthly Target 2 | 37.21 | | Monthly Target 3 | 39.533333333333 | | Monthly Target 4 | 41.78 | | Monthly Target 5 | 44.1 |
Monthly price and volumes Iac Interactivecorp
| Date |
Closing |
Open |
Range |
Volume |
Tue 29 July 2025 |
39.45 (5.65%) |
37.29 |
37.29 - 41.86 |
0.7821 times |
Mon 30 June 2025 |
37.34 (3.84%) |
35.85 |
34.84 - 37.91 |
1.0863 times |
Fri 30 May 2025 |
35.96 (2.92%) |
35.40 |
33.11 - 39.94 |
1.3643 times |
Wed 30 April 2025 |
34.94 (-23.94%) |
37.96 |
32.05 - 40.30 |
1.3785 times |
Mon 31 March 2025 |
45.94 (-0.61%) |
46.36 |
42.61 - 50.09 |
1.2716 times |
Fri 28 February 2025 |
46.22 (9.19%) |
41.75 |
40.86 - 48.50 |
1.2074 times |
Fri 31 January 2025 |
42.33 (-1.88%) |
43.30 |
39.61 - 44.48 |
0.8126 times |
Tue 31 December 2024 |
43.14 (-9.67%) |
48.25 |
41.08 - 49.69 |
0.7261 times |
Tue 26 November 2024 |
47.76 (-0.4%) |
47.96 |
45.98 - 55.16 |
0.7901 times |
Thu 31 October 2024 |
47.95 (-10.91%) |
53.54 |
47.85 - 54.23 |
0.5811 times |
Mon 30 September 2024 |
53.82 (1.97%) |
52.15 |
48.99 - 55.40 |
0.5379 times |
DMA SMA EMA moving averages of Iac Interactivecorp IAC
DMA (daily moving average) of Iac Interactivecorp IAC
| DMA period | DMA value | | 5 day DMA | 40.43 | | 12 day DMA | 40.59 | | 20 day DMA | 40.17 | | 35 day DMA | 38.74 | | 50 day DMA | 38.13 | | 100 day DMA | 38.54 | | 150 day DMA | 40.16 | | 200 day DMA | 42.55 | EMA (exponential moving average) of Iac Interactivecorp IAC
| EMA period | EMA current | EMA prev | EMA prev2 | | 5 day EMA | 40.23 | 40.62 | 40.76 | | 12 day EMA | 40.29 | 40.44 | 40.46 | | 20 day EMA | 39.92 | 39.97 | 39.93 | | 35 day EMA | 39.26 | 39.25 | 39.19 | | 50 day EMA | 38.35 | 38.31 | 38.23 |
SMA (simple moving average) of Iac Interactivecorp IAC
| SMA period | SMA current | SMA prev | SMA prev2 | | 5 day SMA | 40.43 | 40.76 | 40.85 | | 12 day SMA | 40.59 | 40.69 | 40.8 | | 20 day SMA | 40.17 | 40.07 | 39.93 | | 35 day SMA | 38.74 | 38.65 | 38.54 | | 50 day SMA | 38.13 | 38.11 | 38.08 | | 100 day SMA | 38.54 | 38.59 | 38.65 | | 150 day SMA | 40.16 | 40.17 | 40.19 | | 200 day SMA | 42.55 | 42.62 | 42.68 |
|
|
