HealthequityInc HQY full analysis,charts,indicators,moving averages,SMA,DMA,EMA,ADX,MACD,RSIHealthequity Inc HQY WideScreen charts, DMA,SMA,EMA technical analysis, forecast prediction, by indicators ADX,MACD,RSI,CCI NASDAQ stock exchange
operates under Miscellaneous sector & deals in Business Services
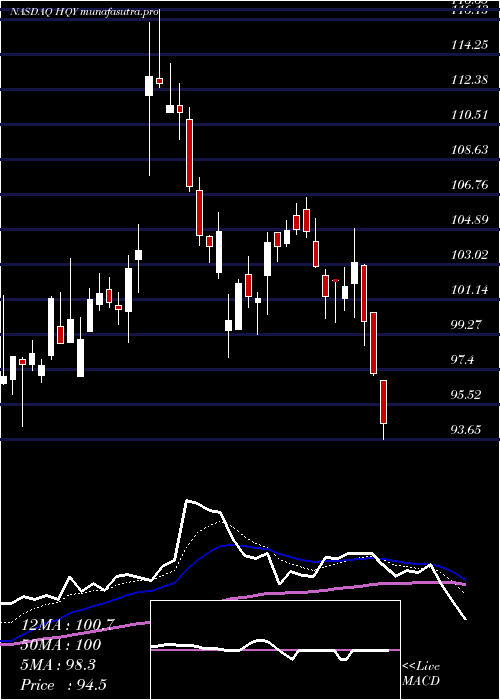
Daily price and charts and targets HealthequityInc Strong Daily Stock price targets for HealthequityInc HQY are 92.99 and 95.43 | Daily Target 1 | 92.48 | | Daily Target 2 | 93.5 | | Daily Target 3 | 94.923333333333 | | Daily Target 4 | 95.94 | | Daily Target 5 | 97.36 |
Daily price and volume Healthequity Inc
| Date |
Closing |
Open |
Range |
Volume |
Fri 05 December 2025 |
94.51 (-1.21%) |
95.55 |
93.91 - 96.35 |
0.8422 times |
Thu 04 December 2025 |
95.67 (-3.01%) |
102.50 |
94.92 - 104.20 |
1.8762 times |
Wed 03 December 2025 |
98.64 (-0.24%) |
98.88 |
97.02 - 100.39 |
1.8705 times |
Tue 02 December 2025 |
98.88 (-3.45%) |
102.20 |
98.87 - 102.72 |
0.4615 times |
Mon 01 December 2025 |
102.41 (-2.63%) |
104.91 |
101.31 - 104.94 |
1.3218 times |
Fri 28 November 2025 |
105.18 (0.18%) |
105.46 |
104.50 - 105.66 |
0.327 times |
Wed 26 November 2025 |
104.99 (-0.43%) |
105.37 |
103.50 - 105.83 |
0.8479 times |
Tue 25 November 2025 |
105.44 (1.74%) |
103.57 |
102.90 - 105.96 |
0.7174 times |
Mon 24 November 2025 |
103.64 (1.7%) |
102.48 |
101.91 - 104.77 |
0.8922 times |
Fri 21 November 2025 |
101.91 (1.17%) |
100.61 |
100.00 - 103.12 |
0.8433 times |
Thu 20 November 2025 |
100.73 (-2.72%) |
104.56 |
100.58 - 105.48 |
1.0077 times |
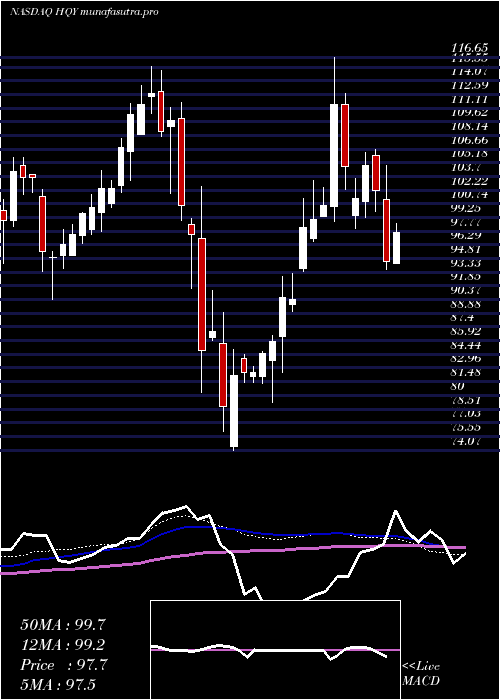
Weekly price and charts HealthequityInc Strong weekly Stock price targets for HealthequityInc HQY are 88.7 and 99.73 | Weekly Target 1 | 86.76 | | Weekly Target 2 | 90.63 | | Weekly Target 3 | 97.786666666667 | | Weekly Target 4 | 101.66 | | Weekly Target 5 | 108.82 |
Weekly price and volumes for Healthequity Inc
| Date |
Closing |
Open |
Range |
Volume |
Fri 05 December 2025 |
94.51 (-10.14%) |
104.91 |
93.91 - 104.94 |
1.4421 times |
Fri 28 November 2025 |
105.18 (3.21%) |
102.48 |
101.91 - 105.96 |
0.6302 times |
Fri 21 November 2025 |
101.91 (0.14%) |
100.89 |
99.21 - 105.48 |
1.3539 times |
Fri 14 November 2025 |
101.77 (8.6%) |
95.42 |
95.00 - 101.84 |
1.2462 times |
Fri 07 November 2025 |
93.71 (-0.92%) |
93.73 |
91.24 - 95.53 |
0.7761 times |
Fri 31 October 2025 |
94.58 (0%) |
93.15 |
92.77 - 95.39 |
0.1641 times |
Fri 31 October 2025 |
94.58 (-1.99%) |
96.63 |
92.77 - 97.74 |
0.9832 times |
Fri 24 October 2025 |
96.50 (5.51%) |
92.07 |
91.94 - 97.26 |
1.1335 times |
Fri 17 October 2025 |
91.46 (1.04%) |
91.04 |
88.74 - 95.67 |
1.142 times |
Fri 10 October 2025 |
90.52 (2.18%) |
88.86 |
87.58 - 94.40 |
1.1287 times |
Fri 03 October 2025 |
88.59 (-8.23%) |
96.46 |
88.38 - 96.46 |
1.1531 times |
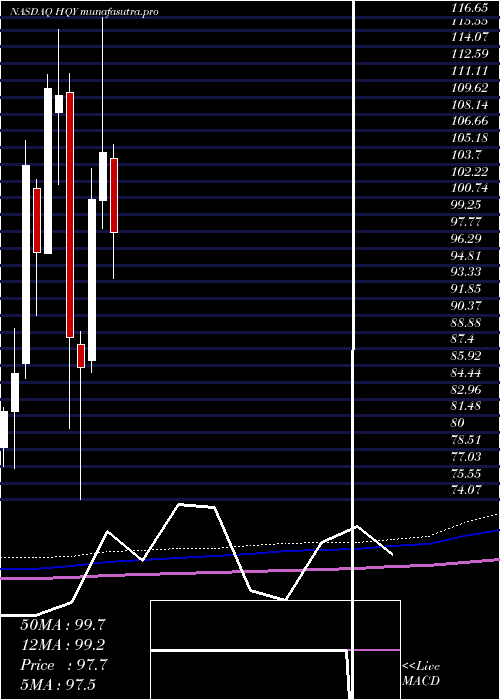
Monthly price and charts HealthequityInc Strong monthly Stock price targets for HealthequityInc HQY are 88.7 and 99.73 | Monthly Target 1 | 86.76 | | Monthly Target 2 | 90.63 | | Monthly Target 3 | 97.786666666667 | | Monthly Target 4 | 101.66 | | Monthly Target 5 | 108.82 |
Monthly price and volumes Healthequity Inc
| Date |
Closing |
Open |
Range |
Volume |
Fri 05 December 2025 |
94.51 (-10.14%) |
104.91 |
93.91 - 104.94 |
0.2681 times |
Fri 28 November 2025 |
105.18 (11.21%) |
93.73 |
91.24 - 105.96 |
0.7449 times |
Fri 31 October 2025 |
94.58 (-0.2%) |
93.78 |
87.58 - 97.74 |
0.9879 times |
Tue 30 September 2025 |
94.77 (6.09%) |
89.01 |
88.74 - 98.57 |
1.2916 times |
Fri 29 August 2025 |
89.33 (-7.91%) |
95.04 |
86.63 - 95.98 |
1.0566 times |
Thu 31 July 2025 |
97.00 (-7.41%) |
104.26 |
93.65 - 105.47 |
0.9673 times |
Mon 30 June 2025 |
104.76 (4.12%) |
100.49 |
98.05 - 116.65 |
1.2309 times |
Fri 30 May 2025 |
100.61 (17.37%) |
86.37 |
85.32 - 103.32 |
1.0382 times |
Wed 30 April 2025 |
85.72 (-3%) |
87.78 |
74.07 - 88.94 |
1.0633 times |
Mon 31 March 2025 |
88.37 (-19.49%) |
110.01 |
80.33 - 111.70 |
1.3512 times |
Fri 28 February 2025 |
109.76 (-0.6%) |
108.26 |
101.91 - 115.59 |
0.6968 times |
DMA SMA EMA moving averages of Healthequity Inc HQY
DMA (daily moving average) of Healthequity Inc HQY
| DMA period | DMA value | | 5 day DMA | 98.02 | | 12 day DMA | 101.3 | | 20 day DMA | 100.68 | | 35 day DMA | 98.07 | | 50 day DMA | 96.21 | | 100 day DMA | 94.51 | | 150 day DMA | 96.55 | | 200 day DMA | 95.38 | EMA (exponential moving average) of Healthequity Inc HQY
| EMA period | EMA current | EMA prev | EMA prev2 | | 5 day EMA | 97.62 | 99.18 | 100.93 | | 12 day EMA | 99.56 | 100.48 | 101.36 | | 20 day EMA | 99.48 | 100 | 100.46 | | 35 day EMA | 98.32 | 98.54 | 98.71 | | 50 day EMA | 96.25 | 96.32 | 96.35 |
SMA (simple moving average) of Healthequity Inc HQY
| SMA period | SMA current | SMA prev | SMA prev2 | | 5 day SMA | 98.02 | 100.16 | 102.02 | | 12 day SMA | 101.3 | 101.98 | 102.36 | | 20 day SMA | 100.68 | 100.59 | 100.53 | | 35 day SMA | 98.07 | 97.97 | 97.88 | | 50 day SMA | 96.21 | 96.25 | 96.22 | | 100 day SMA | 94.51 | 94.54 | 94.55 | | 150 day SMA | 96.55 | 96.5 | 96.44 | | 200 day SMA | 95.38 | 95.47 | 95.56 |
|
|
