HerculesfshoreInc HERO full analysis,charts,indicators,moving averages,SMA,DMA,EMA,ADX,MACD,RSIHerculesfshore Inc HERO WideScreen charts, DMA,SMA,EMA technical analysis, forecast prediction, by indicators ADX,MACD,RSI,CCI NASDAQ stock exchange
operates under Energy sector & deals in Oil & Gas Production
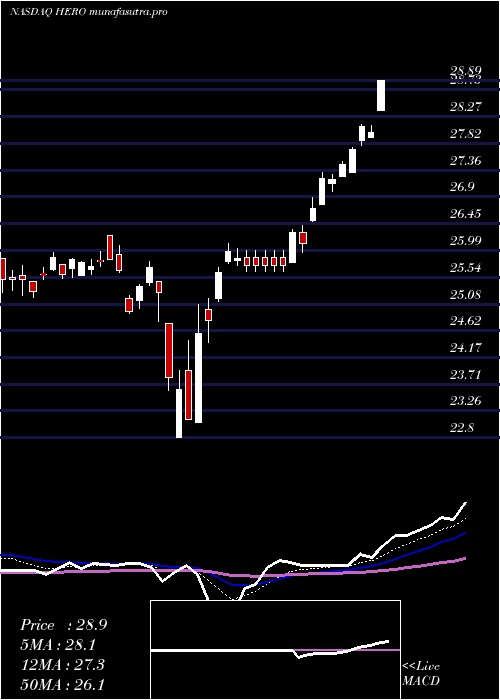
Daily price and charts and targets HerculesfshoreInc Strong Daily Stock price targets for HerculesfshoreInc HERO are 30.88 and 31.21 | Daily Target 1 | 30.65 | | Daily Target 2 | 30.78 | | Daily Target 3 | 30.976666666667 | | Daily Target 4 | 31.11 | | Daily Target 5 | 31.31 |
Daily price and volume Herculesfshore Inc
| Date |
Closing |
Open |
Range |
Volume |
Fri 05 December 2025 |
30.92 (0.03%) |
30.84 |
30.84 - 31.17 |
0.3757 times |
Thu 04 December 2025 |
30.91 (-0.06%) |
30.97 |
30.84 - 31.18 |
0.8404 times |
Wed 03 December 2025 |
30.93 (-0.77%) |
30.96 |
30.86 - 31.03 |
0.5848 times |
Tue 02 December 2025 |
31.17 (-0.64%) |
31.28 |
31.17 - 31.40 |
0.2208 times |
Mon 01 December 2025 |
31.37 (0.26%) |
31.22 |
31.22 - 31.45 |
0.6894 times |
Fri 28 November 2025 |
31.29 (0.16%) |
31.22 |
31.18 - 31.54 |
0.6507 times |
Wed 26 November 2025 |
31.24 (0.58%) |
31.02 |
30.78 - 31.36 |
0.306 times |
Tue 25 November 2025 |
31.06 (0.26%) |
30.87 |
30.67 - 31.17 |
3.0868 times |
Mon 24 November 2025 |
30.98 (1.67%) |
30.51 |
30.51 - 31.23 |
2.4516 times |
Fri 21 November 2025 |
30.47 (2.32%) |
30.33 |
30.23 - 30.65 |
0.794 times |
Thu 20 November 2025 |
29.78 (-2.17%) |
30.41 |
29.60 - 30.56 |
2.3005 times |
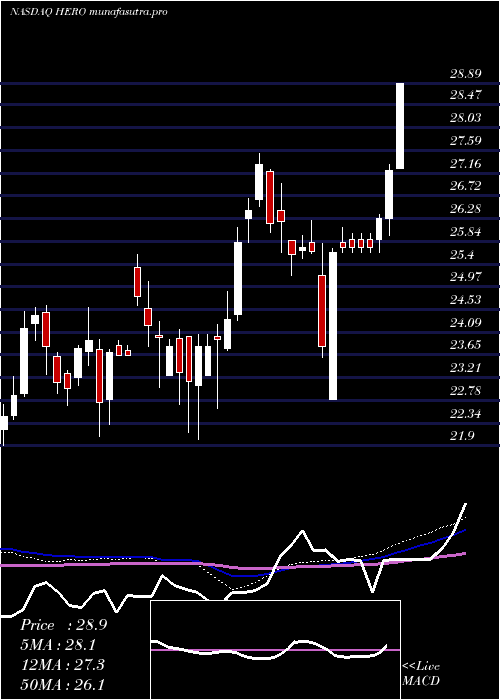
Weekly price and charts HerculesfshoreInc Strong weekly Stock price targets for HerculesfshoreInc HERO are 30.58 and 31.19 | Weekly Target 1 | 30.46 | | Weekly Target 2 | 30.69 | | Weekly Target 3 | 31.07 | | Weekly Target 4 | 31.3 | | Weekly Target 5 | 31.68 |
Weekly price and volumes for Herculesfshore Inc
| Date |
Closing |
Open |
Range |
Volume |
Fri 05 December 2025 |
30.92 (-1.18%) |
31.22 |
30.84 - 31.45 |
0.4215 times |
Fri 28 November 2025 |
31.29 (2.69%) |
30.51 |
30.51 - 31.54 |
1.0097 times |
Fri 21 November 2025 |
30.47 (-3.51%) |
31.34 |
29.60 - 31.42 |
0.97 times |
Fri 14 November 2025 |
31.58 (-0.38%) |
31.94 |
31.27 - 32.37 |
0.3998 times |
Fri 07 November 2025 |
31.70 (-2.91%) |
32.35 |
31.48 - 32.50 |
0.6779 times |
Fri 31 October 2025 |
32.65 (0%) |
32.47 |
32.41 - 32.73 |
0.2523 times |
Fri 31 October 2025 |
32.65 (-0.55%) |
32.83 |
31.85 - 33.00 |
1.2716 times |
Fri 24 October 2025 |
32.83 (0.83%) |
32.73 |
32.30 - 33.43 |
0.6129 times |
Fri 17 October 2025 |
32.56 (1.37%) |
32.52 |
32.07 - 33.18 |
2.5968 times |
Fri 10 October 2025 |
32.12 (-4.74%) |
33.84 |
31.70 - 34.09 |
1.7876 times |
Fri 03 October 2025 |
33.72 (0.42%) |
33.87 |
33.51 - 34.32 |
1.9662 times |
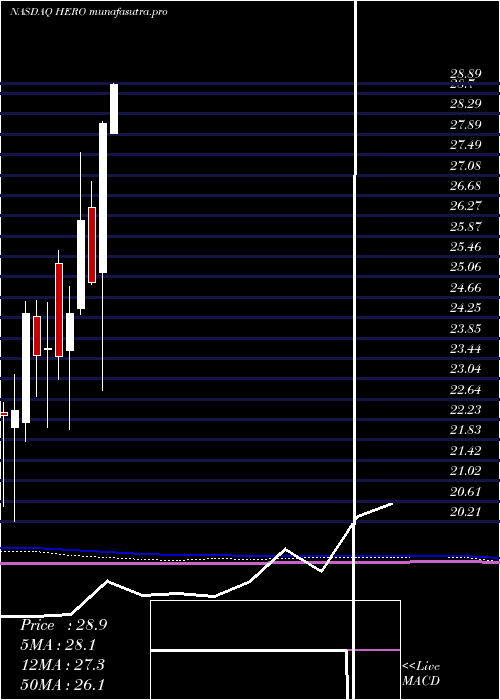
Monthly price and charts HerculesfshoreInc Strong monthly Stock price targets for HerculesfshoreInc HERO are 30.58 and 31.19 | Monthly Target 1 | 30.46 | | Monthly Target 2 | 30.69 | | Monthly Target 3 | 31.07 | | Monthly Target 4 | 31.3 | | Monthly Target 5 | 31.68 |
Monthly price and volumes Herculesfshore Inc
| Date |
Closing |
Open |
Range |
Volume |
Fri 05 December 2025 |
30.92 (-1.18%) |
31.22 |
30.84 - 31.45 |
0.0773 times |
Fri 28 November 2025 |
31.29 (-4.17%) |
32.35 |
29.60 - 32.50 |
0.5606 times |
Fri 31 October 2025 |
32.65 (-3.63%) |
34.32 |
31.70 - 34.32 |
1.5089 times |
Tue 30 September 2025 |
33.88 (3.36%) |
32.22 |
31.50 - 34.68 |
0.7076 times |
Fri 29 August 2025 |
32.78 (5.13%) |
31.00 |
30.95 - 33.94 |
0.9181 times |
Thu 31 July 2025 |
31.18 (-4.74%) |
32.73 |
30.85 - 33.00 |
1.2555 times |
Mon 30 June 2025 |
32.73 (11.63%) |
29.08 |
29.08 - 32.73 |
1.2882 times |
Fri 30 May 2025 |
29.32 (4.34%) |
27.91 |
27.89 - 29.75 |
2.3427 times |
Wed 30 April 2025 |
28.10 (12.63%) |
25.14 |
22.80 - 28.14 |
0.6301 times |
Mon 31 March 2025 |
24.95 (-4.73%) |
26.44 |
24.91 - 26.96 |
0.7109 times |
Fri 28 February 2025 |
26.19 (7.64%) |
24.44 |
24.31 - 27.53 |
0.6779 times |
DMA SMA EMA moving averages of Herculesfshore Inc HERO
DMA (daily moving average) of Herculesfshore Inc HERO
| DMA period | DMA value | | 5 day DMA | 31.06 | | 12 day DMA | 30.88 | | 20 day DMA | 31.2 | | 35 day DMA | 31.8 | | 50 day DMA | 32.27 | | 100 day DMA | 32.55 | | 150 day DMA | 31.81 | | 200 day DMA | 30.34 | EMA (exponential moving average) of Herculesfshore Inc HERO
| EMA period | EMA current | EMA prev | EMA prev2 | | 5 day EMA | 31 | 31.04 | 31.1 | | 12 day EMA | 31.08 | 31.11 | 31.15 | | 20 day EMA | 31.29 | 31.33 | 31.37 | | 35 day EMA | 31.74 | 31.79 | 31.84 | | 50 day EMA | 32.26 | 32.31 | 32.37 |
SMA (simple moving average) of Herculesfshore Inc HERO
| SMA period | SMA current | SMA prev | SMA prev2 | | 5 day SMA | 31.06 | 31.13 | 31.2 | | 12 day SMA | 30.88 | 30.89 | 30.91 | | 20 day SMA | 31.2 | 31.25 | 31.31 | | 35 day SMA | 31.8 | 31.85 | 31.91 | | 50 day SMA | 32.27 | 32.32 | 32.37 | | 100 day SMA | 32.55 | 32.56 | 32.56 | | 150 day SMA | 31.81 | 31.79 | 31.77 | | 200 day SMA | 30.34 | 30.33 | 30.31 |
|
|
