HuntingtonBancshares HBANP full analysis,charts,indicators,moving averages,SMA,DMA,EMA,ADX,MACD,RSIHuntington Bancshares HBANP WideScreen charts, DMA,SMA,EMA technical analysis, forecast prediction, by indicators ADX,MACD,RSI,CCI NASDAQ stock exchange
operates under Finance sector & deals in Major Banks
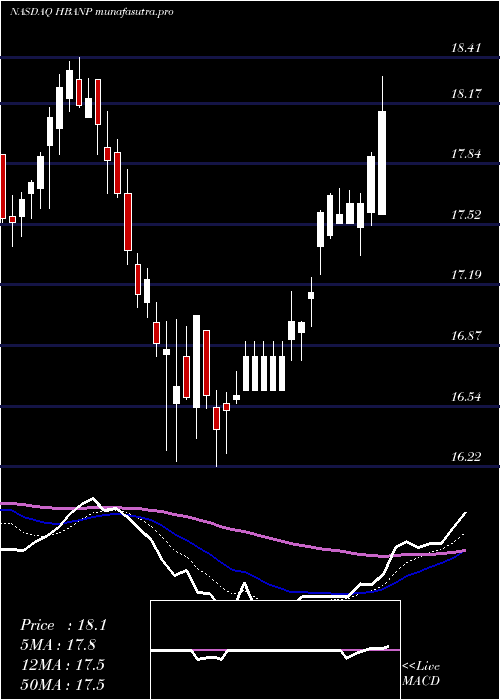
Daily price and charts and targets HuntingtonBancshares Strong Daily Stock price targets for HuntingtonBancshares HBANP are 17.61 and 17.91 | Daily Target 1 | 17.38 | | Daily Target 2 | 17.54 | | Daily Target 3 | 17.676666666667 | | Daily Target 4 | 17.84 | | Daily Target 5 | 17.98 |
Daily price and volume Huntington Bancshares
| Date |
Closing |
Open |
Range |
Volume |
Mon 14 July 2025 |
17.71 (-0.23%) |
17.64 |
17.51 - 17.81 |
0.9965 times |
Fri 11 July 2025 |
17.75 (-0.39%) |
17.77 |
17.70 - 17.84 |
1.1334 times |
Thu 10 July 2025 |
17.82 (0.28%) |
17.80 |
17.74 - 17.85 |
0.4894 times |
Wed 09 July 2025 |
17.77 (0.57%) |
17.80 |
17.66 - 17.85 |
0.8418 times |
Tue 08 July 2025 |
17.67 (0.63%) |
17.59 |
17.50 - 17.68 |
0.5781 times |
Mon 07 July 2025 |
17.56 (-0.4%) |
17.63 |
17.51 - 17.74 |
0.6592 times |
Thu 03 July 2025 |
17.63 (0%) |
17.62 |
17.50 - 17.70 |
0.4158 times |
Wed 02 July 2025 |
17.63 (1.21%) |
17.37 |
17.37 - 17.64 |
0.7302 times |
Tue 01 July 2025 |
17.42 (-0.8%) |
17.27 |
17.27 - 17.56 |
1.1613 times |
Mon 30 June 2025 |
17.56 (0.86%) |
17.37 |
17.37 - 17.73 |
2.9944 times |
Fri 27 June 2025 |
17.41 (-0.68%) |
17.49 |
17.37 - 17.62 |
1.0852 times |
Weekly price and charts HuntingtonBancshares Strong weekly Stock price targets for HuntingtonBancshares HBANP are 17.61 and 17.91 | Weekly Target 1 | 17.38 | | Weekly Target 2 | 17.54 | | Weekly Target 3 | 17.676666666667 | | Weekly Target 4 | 17.84 | | Weekly Target 5 | 17.98 |
Weekly price and volumes for Huntington Bancshares
| Date |
Closing |
Open |
Range |
Volume |
Mon 14 July 2025 |
17.71 (-0.23%) |
17.64 |
17.51 - 17.81 |
0.1852 times |
Fri 11 July 2025 |
17.75 (0.68%) |
17.63 |
17.50 - 17.85 |
0.6882 times |
Thu 03 July 2025 |
17.63 (1.26%) |
17.37 |
17.27 - 17.73 |
0.9856 times |
Fri 27 June 2025 |
17.41 (0%) |
17.35 |
17.29 - 17.62 |
0.8998 times |
Fri 20 June 2025 |
17.41 (0.64%) |
17.22 |
17.16 - 17.42 |
0.452 times |
Fri 13 June 2025 |
17.30 (0.64%) |
17.22 |
17.18 - 17.48 |
0.7593 times |
Fri 06 June 2025 |
17.19 (0.64%) |
17.10 |
16.90 - 17.34 |
0.7829 times |
Fri 30 May 2025 |
17.08 (-0.87%) |
17.25 |
16.81 - 17.44 |
3.4059 times |
Fri 23 May 2025 |
17.23 (-2.1%) |
17.39 |
17.08 - 17.85 |
0.6858 times |
Fri 16 May 2025 |
17.60 (-0.79%) |
17.94 |
17.36 - 17.94 |
1.1553 times |
Fri 09 May 2025 |
17.74 (-2.1%) |
18.10 |
17.66 - 18.24 |
1.1571 times |

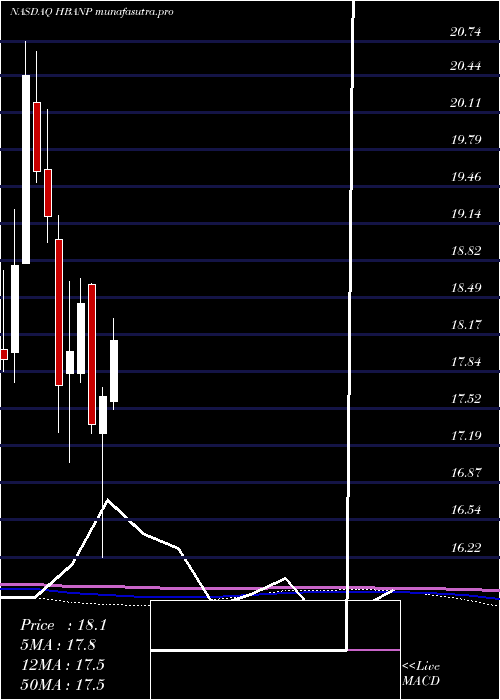
Monthly price and charts HuntingtonBancshares Strong monthly Stock price targets for HuntingtonBancshares HBANP are 17.49 and 18.07 | Monthly Target 1 | 17.03 | | Monthly Target 2 | 17.37 | | Monthly Target 3 | 17.61 | | Monthly Target 4 | 17.95 | | Monthly Target 5 | 18.19 |
Monthly price and volumes Huntington Bancshares
| Date |
Closing |
Open |
Range |
Volume |
Mon 14 July 2025 |
17.71 (0.85%) |
17.27 |
17.27 - 17.85 |
0.2869 times |
Mon 30 June 2025 |
17.56 (2.81%) |
17.10 |
16.90 - 17.73 |
0.7601 times |
Fri 30 May 2025 |
17.08 (-3.12%) |
17.58 |
16.81 - 18.31 |
1.7419 times |
Wed 30 April 2025 |
17.63 (1.44%) |
17.30 |
16.22 - 17.71 |
1.212 times |
Mon 31 March 2025 |
17.38 (-5.75%) |
18.61 |
17.30 - 18.62 |
0.8405 times |
Fri 28 February 2025 |
18.44 (2.33%) |
17.83 |
17.75 - 18.66 |
0.5605 times |
Fri 31 January 2025 |
18.02 (1.69%) |
17.83 |
17.05 - 18.63 |
1.2615 times |
Tue 31 December 2024 |
17.72 (-7.71%) |
19.00 |
17.31 - 19.21 |
1.4868 times |
Tue 26 November 2024 |
19.20 (-2.04%) |
19.62 |
18.98 - 20.14 |
0.9833 times |
Thu 31 October 2024 |
19.60 (-4.11%) |
20.20 |
19.50 - 20.65 |
0.8666 times |
Mon 30 September 2024 |
20.44 (8.9%) |
18.79 |
18.79 - 20.74 |
0.6375 times |
DMA SMA EMA moving averages of Huntington Bancshares HBANP
DMA (daily moving average) of Huntington Bancshares HBANP
| DMA period | DMA value | | 5 day DMA | 17.74 | | 12 day DMA | 17.62 | | 20 day DMA | 17.51 | | 35 day DMA | 17.38 | | 50 day DMA | 17.49 | | 100 day DMA | 17.53 | | 150 day DMA | 17.72 | | 200 day DMA | 18.28 | EMA (exponential moving average) of Huntington Bancshares HBANP
| EMA period | EMA current | EMA prev | EMA prev2 | | 5 day EMA | 17.72 | 17.72 | 17.71 | | 12 day EMA | 17.63 | 17.61 | 17.59 | | 20 day EMA | 17.56 | 17.54 | 17.52 | | 35 day EMA | 17.55 | 17.54 | 17.53 | | 50 day EMA | 17.52 | 17.51 | 17.5 |
SMA (simple moving average) of Huntington Bancshares HBANP
| SMA period | SMA current | SMA prev | SMA prev2 | | 5 day SMA | 17.74 | 17.71 | 17.69 | | 12 day SMA | 17.62 | 17.6 | 17.57 | | 20 day SMA | 17.51 | 17.49 | 17.47 | | 35 day SMA | 17.38 | 17.38 | 17.38 | | 50 day SMA | 17.49 | 17.49 | 17.49 | | 100 day SMA | 17.53 | 17.54 | 17.55 | | 150 day SMA | 17.72 | 17.73 | 17.74 | | 200 day SMA | 18.28 | 18.3 | 18.31 |
|
|
