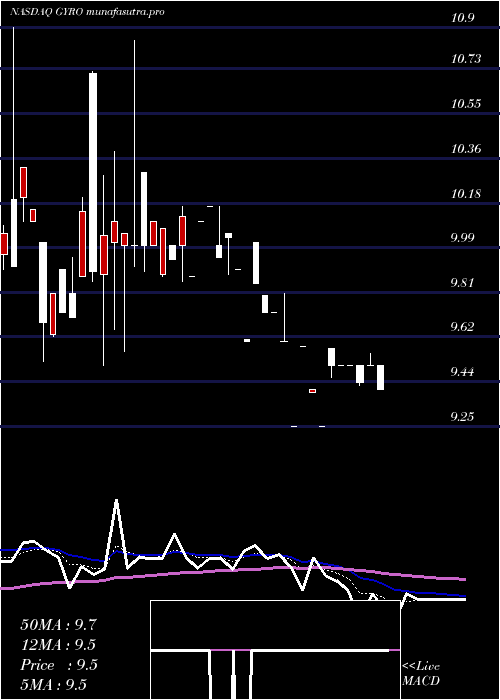
GyrodyneLlc GYRO full analysis,charts,indicators,moving averages,SMA,DMA,EMA,ADX,MACD,RSIGyrodyne Llc GYRO WideScreen charts, DMA,SMA,EMA technical analysis, forecast prediction, by indicators ADX,MACD,RSI,CCI NASDAQ stock exchange
operates under Consumer Services sector & deals in Building Operators
Daily price and charts and targets GyrodyneLlc Strong Daily Stock price targets for GyrodyneLlc GYRO are 9.45 and 9.55 | Daily Target 1 | 9.37 | | Daily Target 2 | 9.43 | | Daily Target 3 | 9.4666666666667 | | Daily Target 4 | 9.53 | | Daily Target 5 | 9.57 |
Daily price and volume Gyrodyne Llc
| Date |
Closing |
Open |
Range |
Volume |
Fri 05 December 2025 |
9.50 (0%) |
9.40 |
9.40 - 9.50 |
0.1604 times |
Wed 03 December 2025 |
9.50 (0%) |
9.50 |
9.50 - 9.55 |
3.7433 times |
Tue 02 December 2025 |
9.50 (0%) |
9.43 |
9.42 - 9.50 |
3.3155 times |
Mon 01 December 2025 |
9.50 (0%) |
9.50 |
9.50 - 9.50 |
0.1604 times |
Fri 28 November 2025 |
9.50 (-0.73%) |
9.50 |
9.50 - 9.50 |
0.0535 times |
Wed 26 November 2025 |
9.57 (3.46%) |
9.50 |
9.45 - 9.57 |
1.4973 times |
Tue 25 November 2025 |
9.25 (-1.49%) |
9.25 |
9.25 - 9.25 |
0.3743 times |
Wed 19 November 2025 |
9.39 (-1.98%) |
9.40 |
9.39 - 9.40 |
0.5348 times |
Fri 14 November 2025 |
9.58 (3.57%) |
9.58 |
9.58 - 9.58 |
0.0535 times |
Tue 11 November 2025 |
9.25 (-3.65%) |
9.25 |
9.25 - 9.25 |
0.107 times |
Fri 07 November 2025 |
9.60 (-1.23%) |
9.60 |
9.60 - 9.80 |
5.8824 times |
Weekly price and charts GyrodyneLlc Strong weekly Stock price targets for GyrodyneLlc GYRO are 9.43 and 9.58 | Weekly Target 1 | 9.33 | | Weekly Target 2 | 9.42 | | Weekly Target 3 | 9.4833333333333 | | Weekly Target 4 | 9.57 | | Weekly Target 5 | 9.63 |
Weekly price and volumes for Gyrodyne Llc
| Date |
Closing |
Open |
Range |
Volume |
Fri 05 December 2025 |
9.50 (0%) |
9.50 |
9.40 - 9.55 |
1.9124 times |
Fri 28 November 2025 |
9.50 (1.17%) |
9.25 |
9.25 - 9.57 |
0.4989 times |
Wed 19 November 2025 |
9.39 (-1.98%) |
9.40 |
9.39 - 9.40 |
0.1386 times |
Fri 14 November 2025 |
9.58 (-0.21%) |
9.25 |
9.25 - 9.58 |
0.0416 times |
Fri 07 November 2025 |
9.60 (-4.1%) |
9.72 |
9.60 - 9.80 |
1.6491 times |
Wed 29 October 2025 |
10.01 (1.11%) |
9.60 |
9.60 - 10.01 |
0.194 times |
Thu 23 October 2025 |
9.90 (-2.56%) |
9.95 |
9.88 - 10.16 |
0.4019 times |
Fri 17 October 2025 |
10.16 (1.6%) |
9.87 |
9.87 - 10.16 |
0.1316 times |
Fri 10 October 2025 |
10.00 (-2.91%) |
10.10 |
9.85 - 10.16 |
1.2195 times |
Fri 03 October 2025 |
10.30 (-3.83%) |
10.04 |
9.50 - 10.85 |
3.8125 times |
Fri 26 September 2025 |
10.71 (6.99%) |
9.80 |
9.62 - 10.72 |
14.5229 times |

Monthly price and charts GyrodyneLlc Strong monthly Stock price targets for GyrodyneLlc GYRO are 9.43 and 9.58 | Monthly Target 1 | 9.33 | | Monthly Target 2 | 9.42 | | Monthly Target 3 | 9.4833333333333 | | Monthly Target 4 | 9.57 | | Monthly Target 5 | 9.63 |
Monthly price and volumes Gyrodyne Llc
| Date |
Closing |
Open |
Range |
Volume |
Fri 05 December 2025 |
9.50 (0%) |
9.50 |
9.40 - 9.55 |
0.2692 times |
Fri 28 November 2025 |
9.50 (-5.09%) |
9.72 |
9.25 - 9.80 |
0.3278 times |
Wed 29 October 2025 |
10.01 (0%) |
10.05 |
9.56 - 10.85 |
0.4343 times |
Tue 30 September 2025 |
10.01 (-2.34%) |
11.00 |
9.03 - 11.00 |
7.0021 times |
Thu 28 August 2025 |
10.25 (19.6%) |
9.10 |
9.05 - 11.11 |
1.0769 times |
Wed 30 July 2025 |
8.57 (-0.46%) |
8.55 |
8.51 - 9.10 |
0.1756 times |
Mon 30 June 2025 |
8.61 (4.24%) |
9.10 |
8.27 - 9.10 |
0.078 times |
Fri 30 May 2025 |
8.26 (4.16%) |
7.55 |
7.55 - 9.69 |
0.0917 times |
Mon 14 April 2025 |
7.93 (-4.69%) |
8.33 |
6.80 - 8.54 |
0.2887 times |
Fri 28 March 2025 |
8.32 (-5.02%) |
8.20 |
8.10 - 8.86 |
0.2556 times |
Wed 26 February 2025 |
8.76 (-4.26%) |
9.02 |
8.10 - 9.35 |
0.1658 times |

DMA SMA EMA moving averages of Gyrodyne Llc GYRO
DMA (daily moving average) of Gyrodyne Llc GYRO
| DMA period | DMA value | | 5 day DMA | 9.5 | | 12 day DMA | 9.49 | | 20 day DMA | 9.67 | | 35 day DMA | 9.81 | | 50 day DMA | 9.91 | | 100 day DMA | 9.44 | | 150 day DMA | 9.5 | | 200 day DMA | 9.13 | EMA (exponential moving average) of Gyrodyne Llc GYRO
| EMA period | EMA current | EMA prev | EMA prev2 | | 5 day EMA | 9.49 | 9.49 | 9.49 | | 12 day EMA | 9.54 | 9.55 | 9.56 | | 20 day EMA | 9.64 | 9.65 | 9.67 | | 35 day EMA | 9.77 | 9.79 | 9.81 | | 50 day EMA | 9.91 | 9.93 | 9.95 |
SMA (simple moving average) of Gyrodyne Llc GYRO
| SMA period | SMA current | SMA prev | SMA prev2 | | 5 day SMA | 9.5 | 9.51 | 9.46 | | 12 day SMA | 9.49 | 9.51 | 9.56 | | 20 day SMA | 9.67 | 9.69 | 9.72 | | 35 day SMA | 9.81 | 9.82 | 9.84 | | 50 day SMA | 9.91 | 9.93 | 9.95 | | 100 day SMA | 9.44 | 9.44 | 9.43 | | 150 day SMA | 9.5 | 9.51 | 9.5 | | 200 day SMA | 9.13 | 9.12 | 9.11 |
|
|
