GreenlandTechnologies GTEC full analysis,charts,indicators,moving averages,SMA,DMA,EMA,ADX,MACD,RSIGreenland Technologies GTEC WideScreen charts, DMA,SMA,EMA technical analysis, forecast prediction, by indicators ADX,MACD,RSI,CCI NASDAQ stock exchange
Daily price and charts and targets GreenlandTechnologies Strong Daily Stock price targets for GreenlandTechnologies GTEC are 1.44 and 1.65 | Daily Target 1 | 1.39 | | Daily Target 2 | 1.48 | | Daily Target 3 | 1.6033333333333 | | Daily Target 4 | 1.69 | | Daily Target 5 | 1.81 |
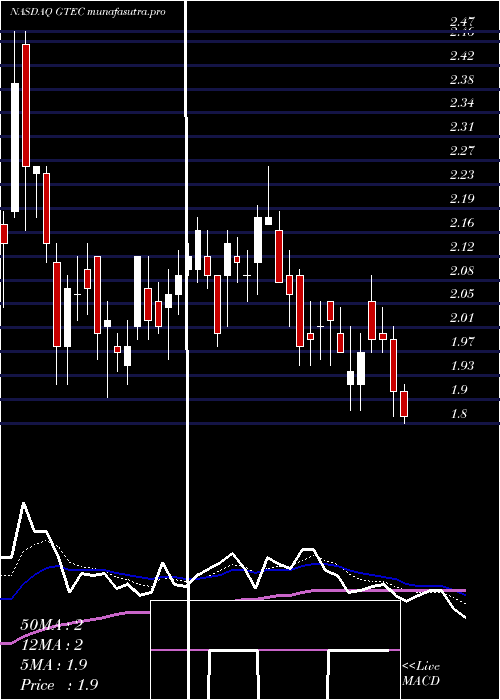
Daily price and volume Greenland Technologies
| Date |
Closing |
Open |
Range |
Volume |
Fri 01 August 2025 |
1.56 (-8.24%) |
1.71 |
1.52 - 1.73 |
2.6133 times |
Thu 31 July 2025 |
1.70 (0.59%) |
1.69 |
1.67 - 1.74 |
0.4523 times |
Wed 30 July 2025 |
1.69 (-1.17%) |
1.72 |
1.67 - 1.74 |
0.3948 times |
Tue 29 July 2025 |
1.71 (-1.16%) |
1.77 |
1.67 - 1.77 |
0.5434 times |
Mon 28 July 2025 |
1.73 (-3.35%) |
1.80 |
1.70 - 1.80 |
0.9465 times |
Fri 25 July 2025 |
1.79 (-3.24%) |
1.87 |
1.75 - 1.87 |
1.4361 times |
Thu 24 July 2025 |
1.85 (-3.14%) |
1.90 |
1.85 - 1.92 |
0.8763 times |
Wed 23 July 2025 |
1.91 (2.14%) |
1.88 |
1.86 - 1.91 |
0.7331 times |
Tue 22 July 2025 |
1.87 (-1.06%) |
1.89 |
1.86 - 1.91 |
0.6255 times |
Mon 21 July 2025 |
1.89 (-3.08%) |
1.98 |
1.87 - 1.98 |
1.3787 times |
Fri 18 July 2025 |
1.95 (-2.5%) |
2.00 |
1.92 - 2.06 |
0.4662 times |
Weekly price and charts GreenlandTechnologies Strong weekly Stock price targets for GreenlandTechnologies GTEC are 1.4 and 1.68 | Weekly Target 1 | 1.35 | | Weekly Target 2 | 1.45 | | Weekly Target 3 | 1.6266666666667 | | Weekly Target 4 | 1.73 | | Weekly Target 5 | 1.91 |
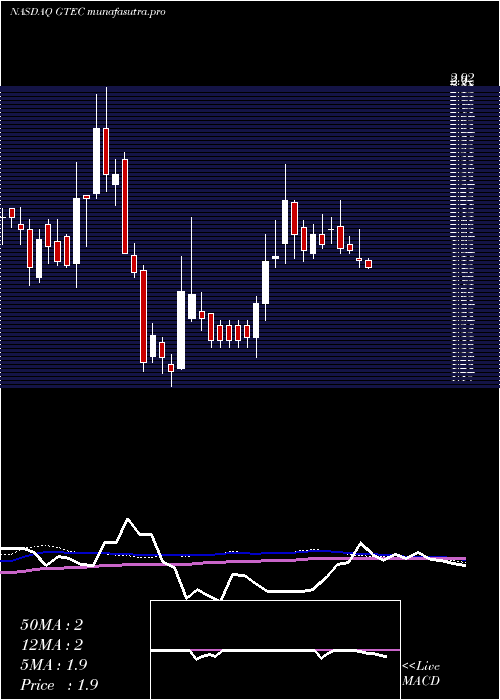
Weekly price and volumes for Greenland Technologies
| Date |
Closing |
Open |
Range |
Volume |
Fri 01 August 2025 |
1.56 (-12.85%) |
1.80 |
1.52 - 1.80 |
1.0935 times |
Fri 25 July 2025 |
1.79 (-8.21%) |
1.98 |
1.75 - 1.98 |
1.1155 times |
Fri 18 July 2025 |
1.95 (2.09%) |
1.91 |
1.86 - 2.06 |
0.7014 times |
Fri 11 July 2025 |
1.91 (-3.05%) |
1.92 |
1.87 - 2.09 |
1.951 times |
Thu 03 July 2025 |
1.97 (-0.51%) |
2.00 |
1.95 - 2.05 |
0.6999 times |
Fri 27 June 2025 |
1.98 (-5.26%) |
2.11 |
1.95 - 2.26 |
1.5872 times |
Fri 20 June 2025 |
2.09 (4.5%) |
2.09 |
2.01 - 2.16 |
0.4725 times |
Fri 13 June 2025 |
2.00 (-2.91%) |
2.06 |
1.98 - 2.18 |
0.7618 times |
Fri 06 June 2025 |
2.06 (4.57%) |
1.95 |
1.92 - 2.12 |
0.9733 times |
Fri 30 May 2025 |
1.97 (-4.37%) |
2.10 |
1.90 - 2.14 |
0.6439 times |
Fri 23 May 2025 |
2.06 (-8.85%) |
2.25 |
1.92 - 2.26 |
1.1455 times |
Monthly price and charts GreenlandTechnologies Strong monthly Stock price targets for GreenlandTechnologies GTEC are 1.44 and 1.65 | Monthly Target 1 | 1.39 | | Monthly Target 2 | 1.48 | | Monthly Target 3 | 1.6033333333333 | | Monthly Target 4 | 1.69 | | Monthly Target 5 | 1.81 |
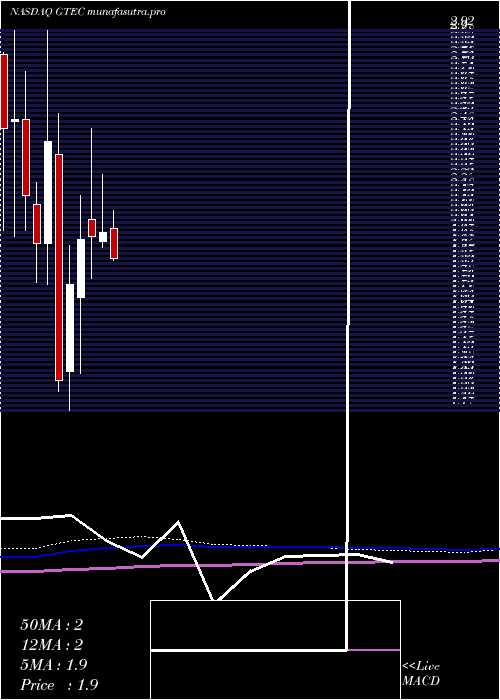
Monthly price and volumes Greenland Technologies
| Date |
Closing |
Open |
Range |
Volume |
Fri 01 August 2025 |
1.56 (-8.24%) |
1.71 |
1.52 - 1.73 |
0.0692 times |
Thu 31 July 2025 |
1.70 (-14.57%) |
2.01 |
1.67 - 2.09 |
0.5696 times |
Mon 30 June 2025 |
1.99 (1.02%) |
1.95 |
1.92 - 2.26 |
0.482 times |
Fri 30 May 2025 |
1.97 (0.51%) |
2.05 |
1.78 - 2.47 |
0.8811 times |
Wed 30 April 2025 |
1.96 (12%) |
1.69 |
1.34 - 2.16 |
1.2182 times |
Mon 31 March 2025 |
1.75 (33.59%) |
1.35 |
1.17 - 1.93 |
3.4513 times |
Fri 28 February 2025 |
1.31 (-45.64%) |
2.35 |
1.26 - 2.54 |
0.6695 times |
Fri 31 January 2025 |
2.41 (24.23%) |
1.94 |
1.75 - 2.92 |
1.9066 times |
Tue 31 December 2024 |
1.94 (-10.19%) |
2.12 |
1.76 - 2.22 |
0.4111 times |
Tue 26 November 2024 |
2.16 (-13.94%) |
2.51 |
2.00 - 2.73 |
0.3415 times |
Thu 31 October 2024 |
2.51 (1.62%) |
2.50 |
1.97 - 2.92 |
0.5939 times |
DMA SMA EMA moving averages of Greenland Technologies GTEC
DMA (daily moving average) of Greenland Technologies GTEC
| DMA period | DMA value | | 5 day DMA | 1.68 | | 12 day DMA | 1.8 | | 20 day DMA | 1.86 | | 35 day DMA | 1.95 | | 50 day DMA | 1.98 | | 100 day DMA | 1.82 | | 150 day DMA | 1.89 | | 200 day DMA | 1.99 | EMA (exponential moving average) of Greenland Technologies GTEC
| EMA period | EMA current | EMA prev | EMA prev2 | | 5 day EMA | 1.67 | 1.73 | 1.75 | | 12 day EMA | 1.77 | 1.81 | 1.83 | | 20 day EMA | 1.83 | 1.86 | 1.88 | | 35 day EMA | 1.91 | 1.93 | 1.94 | | 50 day EMA | 1.97 | 1.99 | 2 |
SMA (simple moving average) of Greenland Technologies GTEC
| SMA period | SMA current | SMA prev | SMA prev2 | | 5 day SMA | 1.68 | 1.72 | 1.75 | | 12 day SMA | 1.8 | 1.84 | 1.85 | | 20 day SMA | 1.86 | 1.88 | 1.89 | | 35 day SMA | 1.95 | 1.96 | 1.98 | | 50 day SMA | 1.98 | 1.99 | 2 | | 100 day SMA | 1.82 | 1.82 | 1.82 | | 150 day SMA | 1.89 | 1.89 | 1.89 | | 200 day SMA | 1.99 | 1.99 | 1.99 |
|
|
