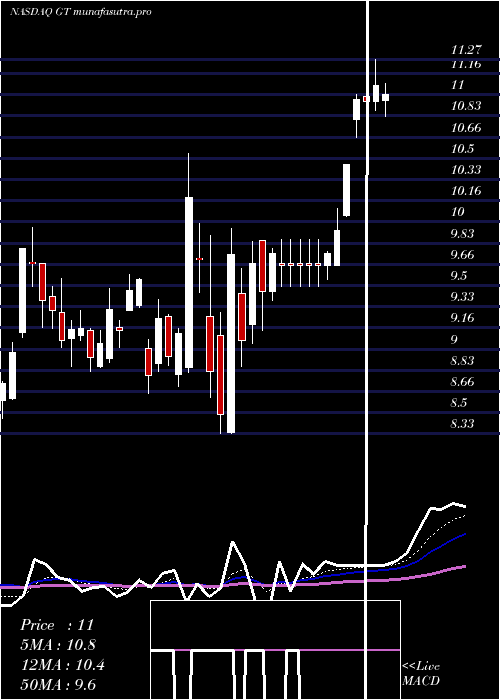
GoodyearTire GT full analysis,charts,indicators,moving averages,SMA,DMA,EMA,ADX,MACD,RSIGoodyear Tire GT WideScreen charts, DMA,SMA,EMA technical analysis, forecast prediction, by indicators ADX,MACD,RSI,CCI NASDAQ stock exchange
operates under Consumer Durables sector & deals in Automotive Aftermarket
Daily price and charts and targets GoodyearTire Strong Daily Stock price targets for GoodyearTire GT are 10.96 and 11.37 | Daily Target 1 | 10.88 | | Daily Target 2 | 11.03 | | Daily Target 3 | 11.286666666667 | | Daily Target 4 | 11.44 | | Daily Target 5 | 11.7 |
Daily price and volume Goodyear Tire
| Date |
Closing |
Open |
Range |
Volume |
Fri 11 July 2025 |
11.19 (-2.27%) |
11.38 |
11.13 - 11.54 |
0.8859 times |
Thu 10 July 2025 |
11.45 (1.33%) |
11.30 |
11.14 - 11.46 |
0.887 times |
Wed 09 July 2025 |
11.30 (-2.16%) |
11.54 |
11.25 - 11.65 |
0.8693 times |
Tue 08 July 2025 |
11.55 (6.06%) |
10.98 |
10.98 - 11.79 |
1.1889 times |
Mon 07 July 2025 |
10.89 (-3.97%) |
11.10 |
10.76 - 11.17 |
1.0218 times |
Thu 03 July 2025 |
11.34 (2.35%) |
11.09 |
11.09 - 11.47 |
0.5561 times |
Wed 02 July 2025 |
11.08 (3.94%) |
10.65 |
10.59 - 11.13 |
1.2229 times |
Tue 01 July 2025 |
10.66 (2.8%) |
10.28 |
10.27 - 10.78 |
1.1486 times |
Mon 30 June 2025 |
10.37 (-3.26%) |
10.75 |
10.26 - 10.85 |
1.1163 times |
Fri 27 June 2025 |
10.72 (1.8%) |
10.56 |
10.56 - 10.83 |
1.1031 times |
Thu 26 June 2025 |
10.53 (1.45%) |
10.38 |
10.26 - 10.57 |
0.5757 times |
Weekly price and charts GoodyearTire Strong weekly Stock price targets for GoodyearTire GT are 10.98 and 12.01 | Weekly Target 1 | 10.22 | | Weekly Target 2 | 10.7 | | Weekly Target 3 | 11.246666666667 | | Weekly Target 4 | 11.73 | | Weekly Target 5 | 12.28 |
Weekly price and volumes for Goodyear Tire
| Date |
Closing |
Open |
Range |
Volume |
Fri 11 July 2025 |
11.19 (-1.32%) |
11.10 |
10.76 - 11.79 |
1.2149 times |
Thu 03 July 2025 |
11.34 (5.78%) |
10.75 |
10.26 - 11.47 |
1.0124 times |
Fri 27 June 2025 |
10.72 (4.69%) |
10.20 |
9.97 - 10.83 |
1.0786 times |
Fri 20 June 2025 |
10.24 (-6.4%) |
10.56 |
10.16 - 10.71 |
0.631 times |
Fri 13 June 2025 |
10.94 (2.82%) |
10.98 |
10.82 - 12.03 |
1.0797 times |
Fri 06 June 2025 |
10.64 (-6.75%) |
11.30 |
10.49 - 11.50 |
0.879 times |
Fri 30 May 2025 |
11.41 (4.2%) |
11.09 |
10.92 - 11.69 |
0.8227 times |
Fri 23 May 2025 |
10.95 (1.67%) |
10.57 |
10.38 - 11.29 |
1.0385 times |
Fri 16 May 2025 |
10.77 (-0.83%) |
11.35 |
10.43 - 11.54 |
1.0304 times |
Fri 09 May 2025 |
10.86 (-1.36%) |
10.84 |
10.61 - 11.44 |
1.2129 times |
Fri 02 May 2025 |
11.01 (0.64%) |
10.94 |
10.40 - 11.27 |
0.7252 times |

Monthly price and charts GoodyearTire Strong monthly Stock price targets for GoodyearTire GT are 10.73 and 12.25 | Monthly Target 1 | 9.56 | | Monthly Target 2 | 10.38 | | Monthly Target 3 | 11.083333333333 | | Monthly Target 4 | 11.9 | | Monthly Target 5 | 12.6 |
Monthly price and volumes Goodyear Tire
| Date |
Closing |
Open |
Range |
Volume |
Fri 11 July 2025 |
11.19 (7.91%) |
10.28 |
10.27 - 11.79 |
0.5268 times |
Mon 30 June 2025 |
10.37 (-9.11%) |
11.30 |
9.97 - 12.03 |
1.0676 times |
Fri 30 May 2025 |
11.41 (4.87%) |
10.84 |
10.38 - 11.69 |
1.1827 times |
Wed 30 April 2025 |
10.88 (17.75%) |
9.25 |
8.33 - 11.27 |
1.3847 times |
Mon 31 March 2025 |
9.24 (-2.22%) |
9.49 |
8.28 - 9.95 |
0.9436 times |
Fri 28 February 2025 |
9.45 (6.54%) |
8.56 |
8.09 - 10.75 |
1.2031 times |
Fri 31 January 2025 |
8.87 (-1.44%) |
9.10 |
8.45 - 9.61 |
0.9096 times |
Tue 31 December 2024 |
9.00 (-10.89%) |
10.32 |
8.41 - 10.68 |
0.6074 times |
Tue 26 November 2024 |
10.10 (26.09%) |
8.05 |
8.05 - 10.30 |
0.9959 times |
Thu 31 October 2024 |
8.01 (-9.49%) |
8.85 |
7.97 - 8.90 |
1.1788 times |
Mon 30 September 2024 |
8.85 (0.34%) |
8.68 |
7.27 - 8.86 |
0.9246 times |

DMA SMA EMA moving averages of Goodyear Tire GT
DMA (daily moving average) of Goodyear Tire GT
| DMA period | DMA value | | 5 day DMA | 11.28 | | 12 day DMA | 10.96 | | 20 day DMA | 10.84 | | 35 day DMA | 10.99 | | 50 day DMA | 10.98 | | 100 day DMA | 10.26 | | 150 day DMA | 9.87 | | 200 day DMA | 9.58 | EMA (exponential moving average) of Goodyear Tire GT
| EMA period | EMA current | EMA prev | EMA prev2 | | 5 day EMA | 11.25 | 11.28 | 11.19 | | 12 day EMA | 11.07 | 11.05 | 10.98 | | 20 day EMA | 11 | 10.98 | 10.93 | | 35 day EMA | 10.93 | 10.91 | 10.88 | | 50 day EMA | 10.98 | 10.97 | 10.95 |
SMA (simple moving average) of Goodyear Tire GT
| SMA period | SMA current | SMA prev | SMA prev2 | | 5 day SMA | 11.28 | 11.31 | 11.23 | | 12 day SMA | 10.96 | 10.88 | 10.77 | | 20 day SMA | 10.84 | 10.87 | 10.89 | | 35 day SMA | 10.99 | 10.97 | 10.95 | | 50 day SMA | 10.98 | 10.98 | 10.97 | | 100 day SMA | 10.26 | 10.25 | 10.21 | | 150 day SMA | 9.87 | 9.86 | 9.85 | | 200 day SMA | 9.58 | 9.56 | 9.54 |
|
|
