GossamerBio GOSS full analysis,charts,indicators,moving averages,SMA,DMA,EMA,ADX,MACD,RSIGossamer Bio GOSS WideScreen charts, DMA,SMA,EMA technical analysis, forecast prediction, by indicators ADX,MACD,RSI,CCI NASDAQ stock exchange
operates under Health Care sector & deals in Major Pharmaceuticals
Daily price and charts and targets GossamerBio Strong Daily Stock price targets for GossamerBio GOSS are 1.35 and 1.41 | Daily Target 1 | 1.31 | | Daily Target 2 | 1.33 | | Daily Target 3 | 1.3666666666667 | | Daily Target 4 | 1.39 | | Daily Target 5 | 1.43 |
Daily price and volume Gossamer Bio
| Date |
Closing |
Open |
Range |
Volume |
Fri 11 July 2025 |
1.36 (0%) |
1.34 |
1.34 - 1.40 |
0.1846 times |
Thu 10 July 2025 |
1.36 (0%) |
1.35 |
1.30 - 1.38 |
0.2775 times |
Wed 09 July 2025 |
1.36 (7.09%) |
1.27 |
1.26 - 1.38 |
0.4156 times |
Tue 08 July 2025 |
1.27 (1.6%) |
1.26 |
1.22 - 1.28 |
0.2674 times |
Mon 07 July 2025 |
1.25 (0.81%) |
1.24 |
1.20 - 1.26 |
0.3432 times |
Thu 03 July 2025 |
1.24 (2.48%) |
1.23 |
1.20 - 1.25 |
0.1148 times |
Wed 02 July 2025 |
1.21 (-3.2%) |
1.25 |
1.20 - 1.28 |
0.3124 times |
Tue 01 July 2025 |
1.25 (1.63%) |
1.23 |
1.20 - 1.33 |
0.6343 times |
Mon 30 June 2025 |
1.23 (-1.6%) |
1.26 |
1.22 - 1.30 |
0.5354 times |
Fri 27 June 2025 |
1.25 (-3.85%) |
1.30 |
1.20 - 1.33 |
6.9148 times |
Thu 26 June 2025 |
1.30 (-4.41%) |
1.36 |
1.29 - 1.37 |
0.3326 times |
Weekly price and charts GossamerBio Strong weekly Stock price targets for GossamerBio GOSS are 1.28 and 1.48 | Weekly Target 1 | 1.12 | | Weekly Target 2 | 1.24 | | Weekly Target 3 | 1.32 | | Weekly Target 4 | 1.44 | | Weekly Target 5 | 1.52 |
Weekly price and volumes for Gossamer Bio
| Date |
Closing |
Open |
Range |
Volume |
Fri 11 July 2025 |
1.36 (9.68%) |
1.24 |
1.20 - 1.40 |
0.6305 times |
Thu 03 July 2025 |
1.24 (-0.8%) |
1.26 |
1.20 - 1.33 |
0.6766 times |
Fri 27 June 2025 |
1.25 (-13.19%) |
1.41 |
1.20 - 1.42 |
3.5879 times |
Fri 20 June 2025 |
1.44 (16.13%) |
1.28 |
1.22 - 1.44 |
0.4354 times |
Fri 13 June 2025 |
1.24 (-6.77%) |
1.34 |
1.20 - 1.38 |
0.7089 times |
Fri 06 June 2025 |
1.33 (19.82%) |
1.12 |
1.10 - 1.36 |
0.7422 times |
Fri 30 May 2025 |
1.11 (-7.5%) |
1.20 |
1.09 - 1.21 |
0.4615 times |
Fri 23 May 2025 |
1.20 (15.38%) |
1.05 |
1.03 - 1.23 |
1.2069 times |
Fri 16 May 2025 |
1.04 (-6.31%) |
1.14 |
0.99 - 1.14 |
0.7751 times |
Fri 09 May 2025 |
1.11 (-5.93%) |
1.18 |
1.06 - 1.26 |
0.7751 times |
Fri 02 May 2025 |
1.18 (22.92%) |
0.95 |
0.85 - 1.23 |
1.0892 times |

Monthly price and charts GossamerBio Strong monthly Stock price targets for GossamerBio GOSS are 1.28 and 1.48 | Monthly Target 1 | 1.12 | | Monthly Target 2 | 1.24 | | Monthly Target 3 | 1.32 | | Monthly Target 4 | 1.44 | | Monthly Target 5 | 1.52 |
Monthly price and volumes Gossamer Bio
| Date |
Closing |
Open |
Range |
Volume |
Fri 11 July 2025 |
1.36 (10.57%) |
1.23 |
1.20 - 1.40 |
0.3374 times |
Mon 30 June 2025 |
1.23 (10.81%) |
1.12 |
1.10 - 1.44 |
1.7804 times |
Fri 30 May 2025 |
1.11 (8.82%) |
1.03 |
0.92 - 1.26 |
1.16 times |
Wed 30 April 2025 |
1.02 (-7.27%) |
1.10 |
0.76 - 1.15 |
1.1543 times |
Mon 31 March 2025 |
1.10 (-10.57%) |
1.30 |
1.07 - 1.48 |
0.9954 times |
Fri 28 February 2025 |
1.23 (24.24%) |
0.97 |
0.93 - 1.55 |
1.3118 times |
Fri 31 January 2025 |
0.99 (10%) |
0.91 |
0.83 - 1.18 |
0.7454 times |
Tue 31 December 2024 |
0.90 (28.57%) |
0.77 |
0.71 - 1.10 |
1.1176 times |
Tue 26 November 2024 |
0.70 (-20.45%) |
0.88 |
0.66 - 0.92 |
0.7671 times |
Thu 31 October 2024 |
0.88 (-11.11%) |
0.97 |
0.85 - 1.09 |
0.6307 times |
Mon 30 September 2024 |
0.99 (12.5%) |
0.85 |
0.83 - 1.11 |
0.6442 times |

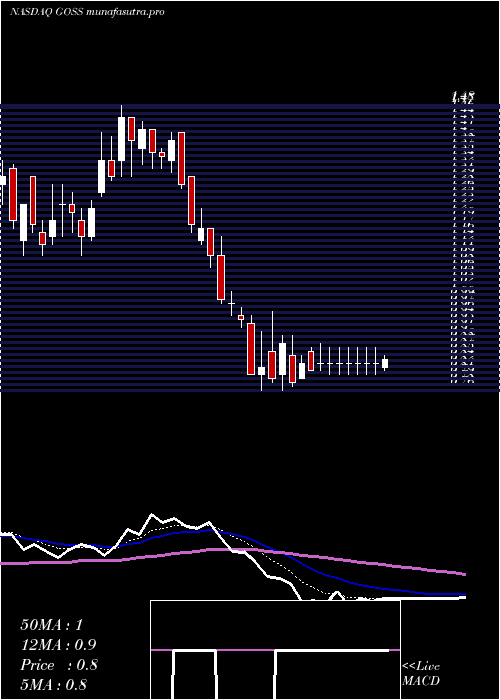
DMA SMA EMA moving averages of Gossamer Bio GOSS
DMA (daily moving average) of Gossamer Bio GOSS
| DMA period | DMA value | | 5 day DMA | 1.32 | | 12 day DMA | 1.29 | | 20 day DMA | 1.3 | | 35 day DMA | 1.26 | | 50 day DMA | 1.2 | | 100 day DMA | 1.15 | | 150 day DMA | 1.09 | | 200 day DMA | 1.04 | EMA (exponential moving average) of Gossamer Bio GOSS
| EMA period | EMA current | EMA prev | EMA prev2 | | 5 day EMA | 1.33 | 1.31 | 1.29 | | 12 day EMA | 1.3 | 1.29 | 1.28 | | 20 day EMA | 1.29 | 1.28 | 1.27 | | 35 day EMA | 1.24 | 1.23 | 1.22 | | 50 day EMA | 1.19 | 1.18 | 1.17 |
SMA (simple moving average) of Gossamer Bio GOSS
| SMA period | SMA current | SMA prev | SMA prev2 | | 5 day SMA | 1.32 | 1.3 | 1.27 | | 12 day SMA | 1.29 | 1.29 | 1.29 | | 20 day SMA | 1.3 | 1.29 | 1.29 | | 35 day SMA | 1.26 | 1.25 | 1.24 | | 50 day SMA | 1.2 | 1.19 | 1.19 | | 100 day SMA | 1.15 | 1.15 | 1.15 | | 150 day SMA | 1.09 | 1.08 | 1.08 | | 200 day SMA | 1.04 | 1.04 | 1.04 |
|
|
