GladstoneCommercial GOOD full analysis,charts,indicators,moving averages,SMA,DMA,EMA,ADX,MACD,RSIGladstone Commercial GOOD WideScreen charts, DMA,SMA,EMA technical analysis, forecast prediction, by indicators ADX,MACD,RSI,CCI NASDAQ stock exchange
operates under Consumer Services sector & deals in Real Estate
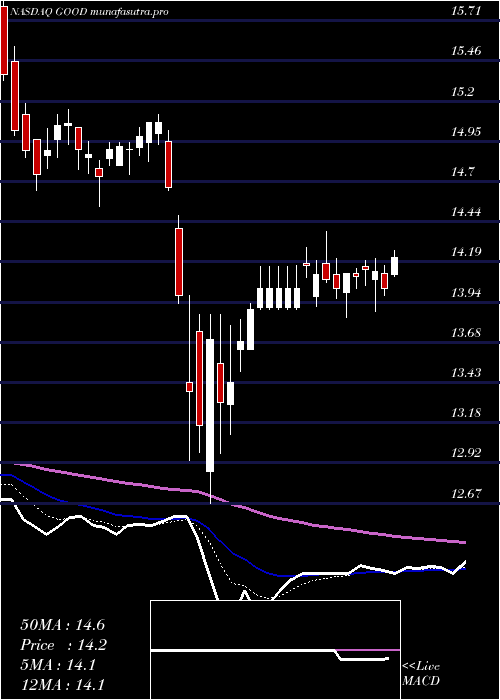
Daily price and charts and targets GladstoneCommercial Strong Daily Stock price targets for GladstoneCommercial GOOD are 13.89 and 14.05 | Daily Target 1 | 13.85 | | Daily Target 2 | 13.92 | | Daily Target 3 | 14.006666666667 | | Daily Target 4 | 14.08 | | Daily Target 5 | 14.17 |
Daily price and volume Gladstone Commercial
| Date |
Closing |
Open |
Range |
Volume |
Fri 11 July 2025 |
14.00 (-0.64%) |
14.02 |
13.93 - 14.09 |
1.1937 times |
Thu 10 July 2025 |
14.09 (-0.63%) |
14.15 |
14.05 - 14.30 |
0.9674 times |
Wed 09 July 2025 |
14.18 (-0.21%) |
14.22 |
14.16 - 14.27 |
0.6446 times |
Tue 08 July 2025 |
14.21 (-0.56%) |
14.27 |
14.17 - 14.33 |
0.9695 times |
Mon 07 July 2025 |
14.29 (-2.26%) |
14.59 |
14.29 - 14.65 |
1.0406 times |
Thu 03 July 2025 |
14.62 (0.27%) |
14.60 |
14.50 - 14.64 |
0.4104 times |
Wed 02 July 2025 |
14.58 (0.55%) |
14.47 |
14.36 - 14.59 |
0.8676 times |
Tue 01 July 2025 |
14.50 (1.19%) |
14.33 |
14.28 - 14.61 |
0.8013 times |
Mon 30 June 2025 |
14.33 (0.42%) |
14.26 |
14.09 - 14.35 |
1.0245 times |
Fri 27 June 2025 |
14.27 (0.14%) |
14.30 |
14.13 - 14.36 |
2.0805 times |
Thu 26 June 2025 |
14.25 (1.5%) |
14.05 |
14.02 - 14.27 |
1.13 times |
Weekly price and charts GladstoneCommercial Strong weekly Stock price targets for GladstoneCommercial GOOD are 13.61 and 14.33 | Weekly Target 1 | 13.47 | | Weekly Target 2 | 13.74 | | Weekly Target 3 | 14.193333333333 | | Weekly Target 4 | 14.46 | | Weekly Target 5 | 14.91 |
Weekly price and volumes for Gladstone Commercial
| Date |
Closing |
Open |
Range |
Volume |
Fri 11 July 2025 |
14.00 (-4.24%) |
14.59 |
13.93 - 14.65 |
1.0323 times |
Thu 03 July 2025 |
14.62 (2.45%) |
14.26 |
14.09 - 14.64 |
0.6653 times |
Fri 27 June 2025 |
14.27 (-0.76%) |
14.37 |
14.00 - 14.62 |
1.2893 times |
Fri 20 June 2025 |
14.38 (-0.69%) |
14.46 |
14.25 - 14.59 |
1.4372 times |
Fri 13 June 2025 |
14.48 (0.14%) |
14.46 |
14.41 - 15.03 |
0.8742 times |
Fri 06 June 2025 |
14.46 (0.77%) |
14.33 |
14.20 - 14.55 |
0.7361 times |
Fri 30 May 2025 |
14.35 (3.61%) |
13.94 |
13.87 - 14.40 |
0.7643 times |
Fri 23 May 2025 |
13.85 (-2.81%) |
14.14 |
13.66 - 14.34 |
1.0906 times |
Fri 16 May 2025 |
14.25 (1.21%) |
14.30 |
14.04 - 14.48 |
1.3209 times |
Fri 09 May 2025 |
14.08 (-0.98%) |
14.15 |
13.43 - 14.24 |
0.7898 times |
Fri 02 May 2025 |
14.22 (0.71%) |
14.12 |
13.88 - 14.26 |
0.5872 times |
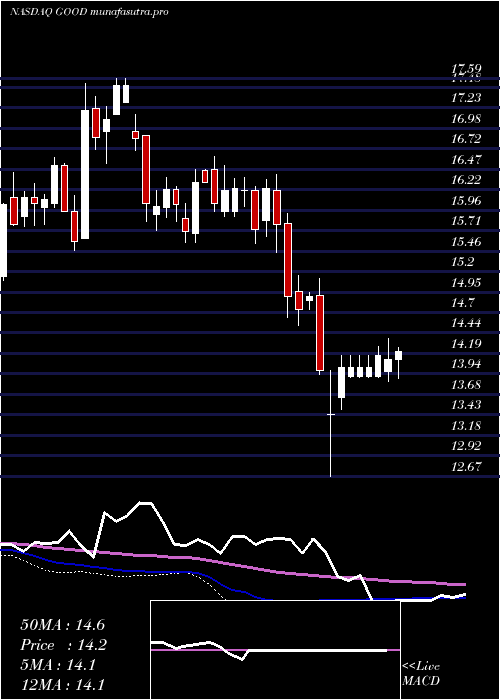
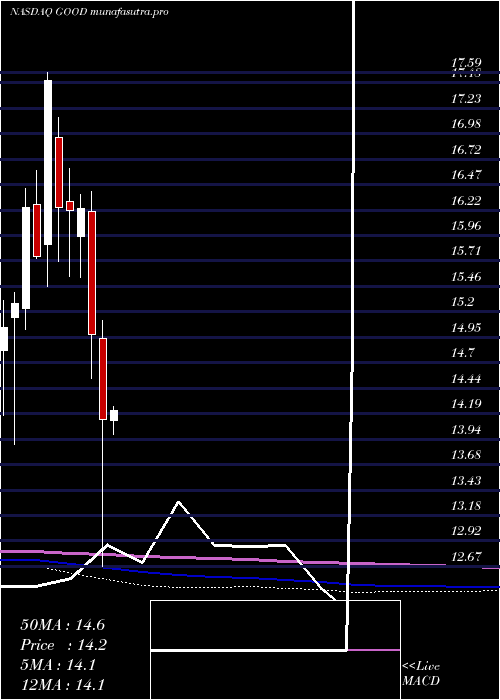
Monthly price and charts GladstoneCommercial Strong monthly Stock price targets for GladstoneCommercial GOOD are 13.61 and 14.33 | Monthly Target 1 | 13.47 | | Monthly Target 2 | 13.74 | | Monthly Target 3 | 14.193333333333 | | Monthly Target 4 | 14.46 | | Monthly Target 5 | 14.91 |
Monthly price and volumes Gladstone Commercial
| Date |
Closing |
Open |
Range |
Volume |
Fri 11 July 2025 |
14.00 (-2.3%) |
14.33 |
13.93 - 14.65 |
0.4358 times |
Mon 30 June 2025 |
14.33 (-0.14%) |
14.33 |
14.00 - 15.03 |
1.3434 times |
Fri 30 May 2025 |
14.35 (1.56%) |
14.12 |
13.43 - 14.48 |
1.248 times |
Wed 30 April 2025 |
14.13 (-5.67%) |
14.94 |
12.67 - 15.12 |
1.1779 times |
Mon 31 March 2025 |
14.98 (-7.7%) |
16.20 |
14.54 - 16.40 |
2.0246 times |
Fri 28 February 2025 |
16.23 (0.12%) |
15.95 |
15.55 - 16.37 |
0.7773 times |
Fri 31 January 2025 |
16.21 (-0.18%) |
16.30 |
15.56 - 16.63 |
0.7345 times |
Tue 31 December 2024 |
16.24 (-7.25%) |
16.94 |
15.71 - 17.14 |
0.7178 times |
Tue 26 November 2024 |
17.51 (11.17%) |
15.87 |
15.46 - 17.59 |
0.8705 times |
Thu 31 October 2024 |
15.75 (-3.02%) |
16.27 |
15.74 - 16.61 |
0.6701 times |
Mon 30 September 2024 |
16.24 (6.21%) |
15.24 |
15.03 - 16.43 |
0.8289 times |
DMA SMA EMA moving averages of Gladstone Commercial GOOD
DMA (daily moving average) of Gladstone Commercial GOOD
| DMA period | DMA value | | 5 day DMA | 14.15 | | 12 day DMA | 14.28 | | 20 day DMA | 14.38 | | 35 day DMA | 14.34 | | 50 day DMA | 14.28 | | 100 day DMA | 14.54 | | 150 day DMA | 15.12 | | 200 day DMA | 15.43 | EMA (exponential moving average) of Gladstone Commercial GOOD
| EMA period | EMA current | EMA prev | EMA prev2 | | 5 day EMA | 14.15 | 14.23 | 14.3 | | 12 day EMA | 14.27 | 14.32 | 14.36 | | 20 day EMA | 14.31 | 14.34 | 14.37 | | 35 day EMA | 14.29 | 14.31 | 14.32 | | 50 day EMA | 14.25 | 14.26 | 14.27 |
SMA (simple moving average) of Gladstone Commercial GOOD
| SMA period | SMA current | SMA prev | SMA prev2 | | 5 day SMA | 14.15 | 14.28 | 14.38 | | 12 day SMA | 14.28 | 14.32 | 14.36 | | 20 day SMA | 14.38 | 14.42 | 14.45 | | 35 day SMA | 14.34 | 14.35 | 14.35 | | 50 day SMA | 14.28 | 14.28 | 14.28 | | 100 day SMA | 14.54 | 14.56 | 14.58 | | 150 day SMA | 15.12 | 15.14 | 15.16 | | 200 day SMA | 15.43 | 15.44 | 15.45 |
|
|
