GogoInc GOGO full analysis,charts,indicators,moving averages,SMA,DMA,EMA,ADX,MACD,RSIGogo Inc GOGO WideScreen charts, DMA,SMA,EMA technical analysis, forecast prediction, by indicators ADX,MACD,RSI,CCI NASDAQ stock exchange
operates under Consumer Services sector & deals in Telecommunications Equipment
Daily price and charts and targets GogoInc Strong Daily Stock price targets for GogoInc GOGO are 7.04 and 7.29 | Daily Target 1 | 6.87 | | Daily Target 2 | 6.96 | | Daily Target 3 | 7.1166666666667 | | Daily Target 4 | 7.21 | | Daily Target 5 | 7.37 |
Daily price and volume Gogo Inc
| Date |
Closing |
Open |
Range |
Volume |
Fri 05 December 2025 |
7.06 (0.43%) |
7.03 |
7.02 - 7.27 |
1.0228 times |
Thu 04 December 2025 |
7.03 (1.3%) |
6.94 |
6.90 - 7.07 |
1.2978 times |
Wed 03 December 2025 |
6.94 (2.81%) |
6.79 |
6.75 - 6.99 |
0.7893 times |
Tue 02 December 2025 |
6.75 (-2.17%) |
6.74 |
6.74 - 6.95 |
0.6727 times |
Mon 01 December 2025 |
6.90 (-3.5%) |
7.01 |
6.79 - 7.05 |
1.1341 times |
Fri 28 November 2025 |
7.15 (0.99%) |
7.10 |
7.02 - 7.18 |
0.5201 times |
Wed 26 November 2025 |
7.08 (-0.56%) |
7.14 |
6.99 - 7.19 |
0.9439 times |
Tue 25 November 2025 |
7.12 (1.71%) |
7.05 |
6.99 - 7.14 |
1.0143 times |
Mon 24 November 2025 |
7.00 (-0.85%) |
7.03 |
6.95 - 7.16 |
1.1224 times |
Fri 21 November 2025 |
7.06 (4.75%) |
6.89 |
6.70 - 7.08 |
1.4826 times |
Thu 20 November 2025 |
6.74 (-3.16%) |
7.06 |
6.70 - 7.15 |
1.2355 times |
Weekly price and charts GogoInc Strong weekly Stock price targets for GogoInc GOGO are 6.9 and 7.43 | Weekly Target 1 | 6.49 | | Weekly Target 2 | 6.78 | | Weekly Target 3 | 7.0233333333333 | | Weekly Target 4 | 7.31 | | Weekly Target 5 | 7.55 |
Weekly price and volumes for Gogo Inc
| Date |
Closing |
Open |
Range |
Volume |
Fri 05 December 2025 |
7.06 (-1.26%) |
7.01 |
6.74 - 7.27 |
0.9726 times |
Fri 28 November 2025 |
7.15 (1.27%) |
7.03 |
6.95 - 7.19 |
0.7123 times |
Fri 21 November 2025 |
7.06 (-1.12%) |
7.09 |
6.70 - 7.76 |
1.3215 times |
Fri 14 November 2025 |
7.14 (-6.54%) |
7.80 |
7.00 - 7.94 |
1.2849 times |
Fri 07 November 2025 |
7.64 (-16.04%) |
8.68 |
6.57 - 8.95 |
1.3445 times |
Fri 31 October 2025 |
9.10 (0%) |
8.74 |
8.66 - 9.25 |
0.2221 times |
Fri 31 October 2025 |
9.10 (-6.86%) |
9.93 |
8.59 - 9.93 |
1.081 times |
Fri 24 October 2025 |
9.77 (10.02%) |
9.02 |
8.86 - 9.90 |
0.862 times |
Fri 17 October 2025 |
8.88 (-0.11%) |
9.07 |
8.72 - 9.83 |
1.0785 times |
Fri 10 October 2025 |
8.89 (1.83%) |
8.74 |
8.56 - 9.45 |
1.1205 times |
Fri 03 October 2025 |
8.73 (-4.17%) |
9.10 |
8.28 - 9.19 |
1.4565 times |

Monthly price and charts GogoInc Strong monthly Stock price targets for GogoInc GOGO are 6.9 and 7.43 | Monthly Target 1 | 6.49 | | Monthly Target 2 | 6.78 | | Monthly Target 3 | 7.0233333333333 | | Monthly Target 4 | 7.31 | | Monthly Target 5 | 7.55 |
Monthly price and volumes Gogo Inc
| Date |
Closing |
Open |
Range |
Volume |
Fri 05 December 2025 |
7.06 (-1.26%) |
7.01 |
6.74 - 7.27 |
0.1765 times |
Fri 28 November 2025 |
7.15 (-21.43%) |
8.68 |
6.57 - 8.95 |
0.8465 times |
Fri 31 October 2025 |
9.10 (5.94%) |
8.55 |
8.28 - 9.93 |
0.9286 times |
Tue 30 September 2025 |
8.59 (-21.77%) |
10.65 |
8.41 - 11.11 |
1.302 times |
Fri 29 August 2025 |
10.98 (-30.77%) |
15.30 |
10.90 - 16.18 |
1.2092 times |
Thu 31 July 2025 |
15.86 (8.04%) |
14.55 |
14.09 - 16.82 |
0.89 times |
Mon 30 June 2025 |
14.68 (38.36%) |
10.51 |
10.26 - 15.10 |
1.1497 times |
Fri 30 May 2025 |
10.61 (40.16%) |
7.58 |
7.37 - 13.16 |
1.4546 times |
Wed 30 April 2025 |
7.57 (-12.18%) |
8.62 |
6.44 - 8.73 |
0.8934 times |
Mon 31 March 2025 |
8.62 (17.6%) |
7.39 |
6.20 - 8.97 |
1.1495 times |
Fri 28 February 2025 |
7.33 (-13.15%) |
8.15 |
7.00 - 8.71 |
0.5709 times |

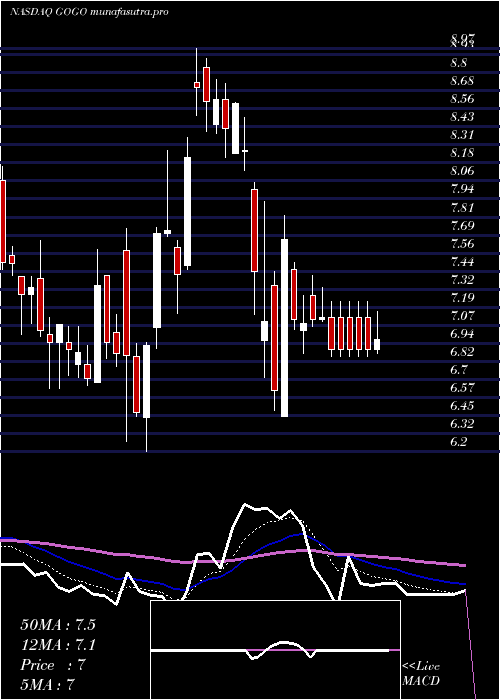
DMA SMA EMA moving averages of Gogo Inc GOGO
DMA (daily moving average) of Gogo Inc GOGO
| DMA period | DMA value | | 5 day DMA | 6.94 | | 12 day DMA | 6.98 | | 20 day DMA | 7.08 | | 35 day DMA | 7.93 | | 50 day DMA | 8.22 | | 100 day DMA | 10.21 | | 150 day DMA | 10.98 | | 200 day DMA | 10.08 | EMA (exponential moving average) of Gogo Inc GOGO
| EMA period | EMA current | EMA prev | EMA prev2 | | 5 day EMA | 6.99 | 6.96 | 6.93 | | 12 day EMA | 7.07 | 7.07 | 7.08 | | 20 day EMA | 7.27 | 7.29 | 7.32 | | 35 day EMA | 7.65 | 7.68 | 7.72 | | 50 day EMA | 8.15 | 8.19 | 8.24 |
SMA (simple moving average) of Gogo Inc GOGO
| SMA period | SMA current | SMA prev | SMA prev2 | | 5 day SMA | 6.94 | 6.95 | 6.96 | | 12 day SMA | 6.98 | 6.96 | 6.95 | | 20 day SMA | 7.08 | 7.11 | 7.2 | | 35 day SMA | 7.93 | 7.98 | 8.05 | | 50 day SMA | 8.22 | 8.25 | 8.28 | | 100 day SMA | 10.21 | 10.29 | 10.38 | | 150 day SMA | 10.98 | 10.98 | 10.98 | | 200 day SMA | 10.08 | 10.08 | 10.09 |
|
|
