GoldenOcean GOGL full analysis,charts,indicators,moving averages,SMA,DMA,EMA,ADX,MACD,RSIGolden Ocean GOGL WideScreen charts, DMA,SMA,EMA technical analysis, forecast prediction, by indicators ADX,MACD,RSI,CCI NASDAQ stock exchange
operates under Consumer Services sector & deals in Marine Transportation
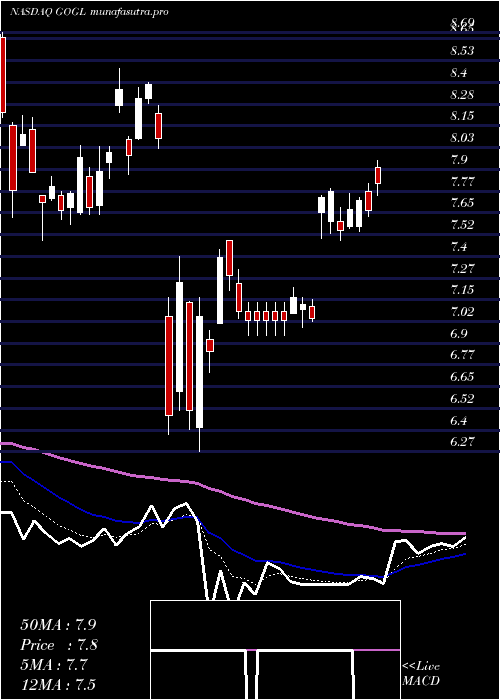
Daily price and charts and targets GoldenOcean Strong Daily Stock price targets for GoldenOcean GOGL are 8.15 and 8.33 | Daily Target 1 | 8.11 | | Daily Target 2 | 8.18 | | Daily Target 3 | 8.29 | | Daily Target 4 | 8.36 | | Daily Target 5 | 8.47 |
Daily price and volume Golden Ocean
| Date |
Closing |
Open |
Range |
Volume |
Mon 14 July 2025 |
8.25 (-1.9%) |
8.40 |
8.22 - 8.40 |
1.0463 times |
Fri 11 July 2025 |
8.41 (2.94%) |
8.32 |
8.22 - 8.42 |
0.7386 times |
Thu 10 July 2025 |
8.17 (5.15%) |
7.82 |
7.82 - 8.27 |
1.6229 times |
Wed 09 July 2025 |
7.77 (-2.63%) |
7.95 |
7.76 - 7.96 |
1.1405 times |
Tue 08 July 2025 |
7.98 (0.5%) |
8.00 |
7.91 - 8.05 |
1.1278 times |
Mon 07 July 2025 |
7.94 (0%) |
7.93 |
7.88 - 8.08 |
0.6796 times |
Thu 03 July 2025 |
7.94 (1.4%) |
7.90 |
7.83 - 8.01 |
1.2812 times |
Wed 02 July 2025 |
7.83 (5.38%) |
7.61 |
7.60 - 7.86 |
1.2104 times |
Tue 01 July 2025 |
7.43 (1.5%) |
7.35 |
7.28 - 7.54 |
0.4983 times |
Mon 30 June 2025 |
7.32 (-2.14%) |
7.45 |
7.26 - 7.45 |
0.6546 times |
Fri 27 June 2025 |
7.48 (-0.53%) |
7.54 |
7.42 - 7.61 |
1.2093 times |
Weekly price and charts GoldenOcean Strong weekly Stock price targets for GoldenOcean GOGL are 8.15 and 8.33 | Weekly Target 1 | 8.11 | | Weekly Target 2 | 8.18 | | Weekly Target 3 | 8.29 | | Weekly Target 4 | 8.36 | | Weekly Target 5 | 8.47 |
Weekly price and volumes for Golden Ocean
| Date |
Closing |
Open |
Range |
Volume |
Mon 14 July 2025 |
8.25 (-1.9%) |
8.40 |
8.22 - 8.40 |
0.3337 times |
Fri 11 July 2025 |
8.41 (5.92%) |
7.93 |
7.76 - 8.42 |
1.6932 times |
Thu 03 July 2025 |
7.94 (6.15%) |
7.45 |
7.26 - 8.01 |
1.1622 times |
Fri 27 June 2025 |
7.48 (-1.97%) |
7.66 |
7.42 - 7.74 |
1.0201 times |
Fri 20 June 2025 |
7.63 (-4.15%) |
7.93 |
7.61 - 7.95 |
0.489 times |
Fri 13 June 2025 |
7.96 (3.38%) |
7.71 |
7.63 - 7.98 |
0.8097 times |
Fri 06 June 2025 |
7.70 (0%) |
7.68 |
7.47 - 7.84 |
0.9543 times |
Fri 30 May 2025 |
7.70 (6.5%) |
7.29 |
7.11 - 7.77 |
1.3249 times |
Fri 23 May 2025 |
7.23 (-10.3%) |
7.98 |
7.05 - 8.05 |
1.2485 times |
Fri 16 May 2025 |
8.06 (7.75%) |
7.89 |
7.79 - 8.13 |
0.9644 times |
Fri 09 May 2025 |
7.48 (-4.35%) |
7.90 |
7.48 - 7.98 |
0.9125 times |

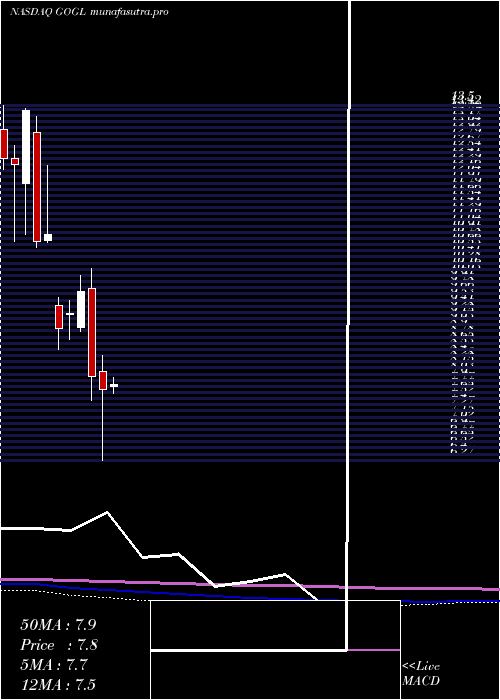
Monthly price and charts GoldenOcean Strong monthly Stock price targets for GoldenOcean GOGL are 7.77 and 8.91 | Monthly Target 1 | 6.84 | | Monthly Target 2 | 7.55 | | Monthly Target 3 | 7.9833333333333 | | Monthly Target 4 | 8.69 | | Monthly Target 5 | 9.12 |
Monthly price and volumes Golden Ocean
| Date |
Closing |
Open |
Range |
Volume |
Mon 14 July 2025 |
8.25 (12.7%) |
7.35 |
7.28 - 8.42 |
0.6281 times |
Mon 30 June 2025 |
7.32 (-4.94%) |
7.68 |
7.26 - 7.98 |
0.7338 times |
Fri 30 May 2025 |
7.70 (-0.26%) |
7.77 |
7.05 - 8.13 |
1.011 times |
Wed 30 April 2025 |
7.72 (-3.26%) |
8.08 |
6.27 - 8.40 |
1.8068 times |
Mon 31 March 2025 |
7.98 (-17.73%) |
9.77 |
7.49 - 10.17 |
2.2659 times |
Fri 28 February 2025 |
9.70 (4.86%) |
8.98 |
8.89 - 10.04 |
1.098 times |
Fri 31 January 2025 |
9.25 (3.24%) |
9.24 |
8.72 - 9.52 |
0.7802 times |
Tue 31 December 2024 |
8.96 (-17.5%) |
9.43 |
8.52 - 9.58 |
0.4662 times |
Tue 26 November 2024 |
10.86 (1.31%) |
10.74 |
10.71 - 12.28 |
0.5921 times |
Thu 31 October 2024 |
10.72 (-19.88%) |
12.95 |
10.61 - 13.27 |
0.6178 times |
Mon 30 September 2024 |
13.38 (8.78%) |
11.91 |
10.86 - 13.44 |
0.6362 times |
DMA SMA EMA moving averages of Golden Ocean GOGL
DMA (daily moving average) of Golden Ocean GOGL
| DMA period | DMA value | | 5 day DMA | 8.12 | | 12 day DMA | 7.84 | | 20 day DMA | 7.8 | | 35 day DMA | 7.69 | | 50 day DMA | 7.73 | | 100 day DMA | 7.88 | | 150 day DMA | 8.29 | | 200 day DMA | 9.17 | EMA (exponential moving average) of Golden Ocean GOGL
| EMA period | EMA current | EMA prev | EMA prev2 | | 5 day EMA | 8.15 | 8.1 | 7.94 | | 12 day EMA | 7.95 | 7.9 | 7.81 | | 20 day EMA | 7.86 | 7.82 | 7.76 | | 35 day EMA | 7.81 | 7.78 | 7.74 | | 50 day EMA | 7.76 | 7.74 | 7.71 |
SMA (simple moving average) of Golden Ocean GOGL
| SMA period | SMA current | SMA prev | SMA prev2 | | 5 day SMA | 8.12 | 8.05 | 7.96 | | 12 day SMA | 7.84 | 7.78 | 7.71 | | 20 day SMA | 7.8 | 7.78 | 7.74 | | 35 day SMA | 7.69 | 7.68 | 7.67 | | 50 day SMA | 7.73 | 7.72 | 7.7 | | 100 day SMA | 7.88 | 7.89 | 7.9 | | 150 day SMA | 8.29 | 8.31 | 8.33 | | 200 day SMA | 9.17 | 9.19 | 9.21 |
|
|
