GohealthInc GOCO full analysis,charts,indicators,moving averages,SMA,DMA,EMA,ADX,MACD,RSIGohealth Inc GOCO WideScreen charts, DMA,SMA,EMA technical analysis, forecast prediction, by indicators ADX,MACD,RSI,CCI NASDAQ stock exchange
Daily price and charts and targets GohealthInc Strong Daily Stock price targets for GohealthInc GOCO are 2.97 and 3.13 | Daily Target 1 | 2.84 | | Daily Target 2 | 2.93 | | Daily Target 3 | 2.9966666666667 | | Daily Target 4 | 3.09 | | Daily Target 5 | 3.16 |
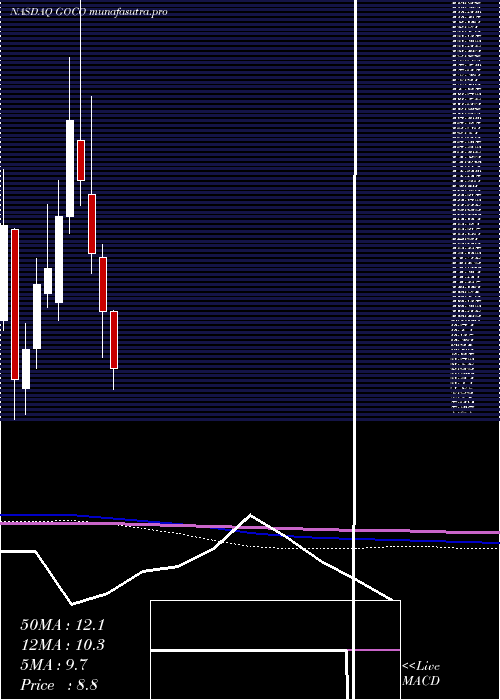
Daily price and volume Gohealth Inc
| Date |
Closing |
Open |
Range |
Volume |
Fri 05 December 2025 |
3.03 (3.06%) |
2.94 |
2.90 - 3.06 |
0.812 times |
Thu 04 December 2025 |
2.94 (-1.67%) |
2.93 |
2.93 - 3.11 |
0.9238 times |
Wed 03 December 2025 |
2.99 (2.05%) |
2.91 |
2.90 - 3.06 |
1.1539 times |
Tue 02 December 2025 |
2.93 (0.69%) |
2.91 |
2.91 - 2.99 |
0.7857 times |
Mon 01 December 2025 |
2.91 (-3%) |
2.99 |
2.79 - 3.00 |
0.7298 times |
Fri 28 November 2025 |
3.00 (2.39%) |
2.92 |
2.88 - 3.05 |
1.2394 times |
Wed 26 November 2025 |
2.93 (0%) |
2.91 |
2.77 - 2.99 |
1.532 times |
Tue 25 November 2025 |
2.93 (4.64%) |
2.81 |
2.72 - 2.95 |
0.9271 times |
Mon 24 November 2025 |
2.80 (8.95%) |
2.59 |
2.57 - 2.82 |
1.1104 times |
Fri 21 November 2025 |
2.57 (11.74%) |
2.29 |
2.28 - 2.57 |
0.7857 times |
Thu 20 November 2025 |
2.30 (0%) |
2.37 |
2.24 - 2.39 |
1.6504 times |

Weekly price and charts GohealthInc Strong weekly Stock price targets for GohealthInc GOCO are 2.91 and 3.23 | Weekly Target 1 | 2.66 | | Weekly Target 2 | 2.84 | | Weekly Target 3 | 2.9766666666667 | | Weekly Target 4 | 3.16 | | Weekly Target 5 | 3.3 |
Weekly price and volumes for Gohealth Inc
| Date |
Closing |
Open |
Range |
Volume |
Fri 05 December 2025 |
3.03 (1%) |
2.99 |
2.79 - 3.11 |
0.7267 times |
Fri 28 November 2025 |
3.00 (16.73%) |
2.59 |
2.57 - 3.05 |
0.7933 times |
Fri 21 November 2025 |
2.57 (1.18%) |
2.51 |
2.17 - 2.57 |
1.1074 times |
Fri 14 November 2025 |
2.54 (-25.07%) |
3.43 |
2.42 - 3.52 |
2.0878 times |
Fri 07 November 2025 |
3.39 (-14.39%) |
3.77 |
3.32 - 3.80 |
0.891 times |
Fri 31 October 2025 |
3.96 (0%) |
4.04 |
3.89 - 4.09 |
0.2392 times |
Fri 31 October 2025 |
3.96 (-11.21%) |
4.46 |
3.89 - 4.47 |
0.8504 times |
Fri 24 October 2025 |
4.46 (1.36%) |
4.46 |
4.32 - 4.62 |
0.9268 times |
Fri 17 October 2025 |
4.40 (-0.23%) |
4.48 |
4.30 - 4.80 |
0.8303 times |
Fri 10 October 2025 |
4.41 (-6.57%) |
4.73 |
4.40 - 5.07 |
1.5472 times |
Fri 03 October 2025 |
4.72 (4.19%) |
4.57 |
4.47 - 4.89 |
0.8568 times |

Monthly price and charts GohealthInc Strong monthly Stock price targets for GohealthInc GOCO are 2.91 and 3.23 | Monthly Target 1 | 2.66 | | Monthly Target 2 | 2.84 | | Monthly Target 3 | 2.9766666666667 | | Monthly Target 4 | 3.16 | | Monthly Target 5 | 3.3 |
Monthly price and volumes Gohealth Inc
| Date |
Closing |
Open |
Range |
Volume |
Fri 05 December 2025 |
3.03 (1%) |
2.99 |
2.79 - 3.11 |
0.1351 times |
Fri 28 November 2025 |
3.00 (-24.24%) |
3.77 |
2.17 - 3.80 |
0.9072 times |
Fri 31 October 2025 |
3.96 (-17.84%) |
4.78 |
3.89 - 5.07 |
0.9184 times |
Tue 30 September 2025 |
4.82 (-5.68%) |
5.04 |
4.32 - 5.17 |
0.9196 times |
Fri 29 August 2025 |
5.11 (-16.64%) |
6.08 |
5.04 - 6.61 |
1.093 times |
Thu 31 July 2025 |
6.13 (10.45%) |
5.56 |
5.55 - 6.50 |
0.909 times |
Mon 30 June 2025 |
5.55 (0.73%) |
5.51 |
5.01 - 7.12 |
1.3282 times |
Fri 30 May 2025 |
5.51 (-47.67%) |
10.52 |
5.51 - 10.56 |
1.4944 times |
Wed 30 April 2025 |
10.53 (-14.18%) |
12.15 |
9.12 - 12.56 |
1.2973 times |
Mon 31 March 2025 |
12.27 (-15.32%) |
14.06 |
11.68 - 17.01 |
0.9978 times |
Fri 28 February 2025 |
14.49 (-11.1%) |
15.69 |
13.72 - 21.00 |
1.2746 times |
DMA SMA EMA moving averages of Gohealth Inc GOCO
DMA (daily moving average) of Gohealth Inc GOCO
| DMA period | DMA value | | 5 day DMA | 2.96 | | 12 day DMA | 2.8 | | 20 day DMA | 2.86 | | 35 day DMA | 3.42 | | 50 day DMA | 3.77 | | 100 day DMA | 4.57 | | 150 day DMA | 5.16 | | 200 day DMA | 7.13 | EMA (exponential moving average) of Gohealth Inc GOCO
| EMA period | EMA current | EMA prev | EMA prev2 | | 5 day EMA | 2.96 | 2.93 | 2.92 | | 12 day EMA | 2.93 | 2.91 | 2.91 | | 20 day EMA | 3.03 | 3.03 | 3.04 | | 35 day EMA | 3.34 | 3.36 | 3.38 | | 50 day EMA | 3.76 | 3.79 | 3.82 |
SMA (simple moving average) of Gohealth Inc GOCO
| SMA period | SMA current | SMA prev | SMA prev2 | | 5 day SMA | 2.96 | 2.95 | 2.95 | | 12 day SMA | 2.8 | 2.75 | 2.7 | | 20 day SMA | 2.86 | 2.88 | 2.93 | | 35 day SMA | 3.42 | 3.45 | 3.5 | | 50 day SMA | 3.77 | 3.8 | 3.83 | | 100 day SMA | 4.57 | 4.6 | 4.63 | | 150 day SMA | 5.16 | 5.2 | 5.25 | | 200 day SMA | 7.13 | 7.21 | 7.29 |
|
|
