GenasysInc GNSS full analysis,charts,indicators,moving averages,SMA,DMA,EMA,ADX,MACD,RSIGenasys Inc GNSS WideScreen charts, DMA,SMA,EMA technical analysis, forecast prediction, by indicators ADX,MACD,RSI,CCI NASDAQ stock exchange
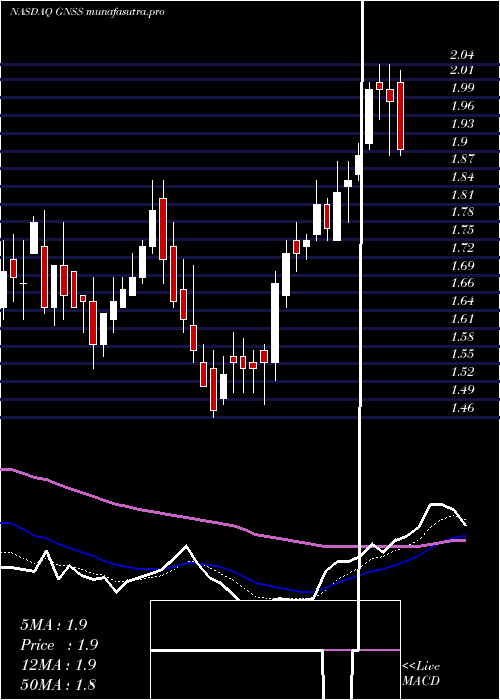
Daily price and charts and targets GenasysInc Strong Daily Stock price targets for GenasysInc GNSS are 1.59 and 1.68 | Daily Target 1 | 1.56 | | Daily Target 2 | 1.61 | | Daily Target 3 | 1.6533333333333 | | Daily Target 4 | 1.7 | | Daily Target 5 | 1.74 |
Daily price and volume Genasys Inc
| Date |
Closing |
Open |
Range |
Volume |
Wed 30 July 2025 |
1.65 (-1.2%) |
1.70 |
1.61 - 1.70 |
0.8043 times |
Tue 29 July 2025 |
1.67 (-6.18%) |
1.81 |
1.66 - 1.81 |
0.6787 times |
Mon 28 July 2025 |
1.78 (-0.56%) |
1.82 |
1.73 - 1.84 |
0.8608 times |
Fri 25 July 2025 |
1.79 (-3.24%) |
1.85 |
1.79 - 1.86 |
0.7523 times |
Thu 24 July 2025 |
1.85 (-4.64%) |
1.97 |
1.83 - 2.00 |
0.8581 times |
Wed 23 July 2025 |
1.94 (-0.51%) |
1.95 |
1.91 - 1.99 |
0.9477 times |
Tue 22 July 2025 |
1.95 (3.72%) |
1.89 |
1.89 - 1.99 |
1.2024 times |
Mon 21 July 2025 |
1.88 (-5.05%) |
1.99 |
1.85 - 2.00 |
1.1728 times |
Fri 18 July 2025 |
1.98 (-1.49%) |
2.05 |
1.95 - 2.05 |
0.8326 times |
Thu 17 July 2025 |
2.01 (4.69%) |
1.92 |
1.91 - 2.04 |
1.8904 times |
Wed 16 July 2025 |
1.92 (1.05%) |
1.91 |
1.89 - 1.97 |
0.3918 times |
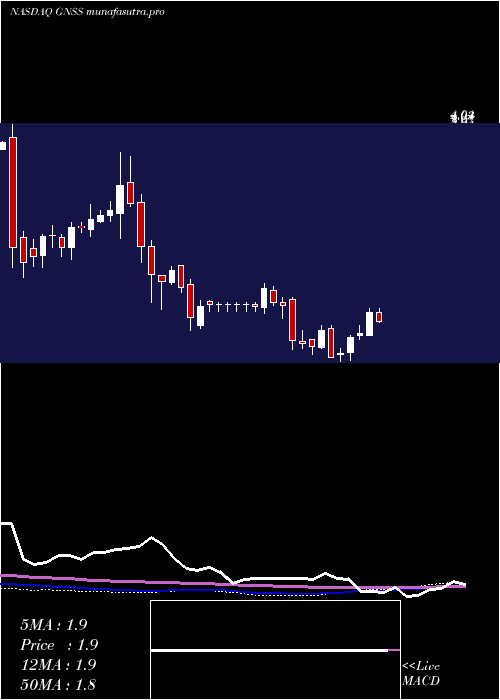
Weekly price and charts GenasysInc Strong weekly Stock price targets for GenasysInc GNSS are 1.52 and 1.75 | Weekly Target 1 | 1.47 | | Weekly Target 2 | 1.56 | | Weekly Target 3 | 1.7 | | Weekly Target 4 | 1.79 | | Weekly Target 5 | 1.93 |
Weekly price and volumes for Genasys Inc
| Date |
Closing |
Open |
Range |
Volume |
Wed 30 July 2025 |
1.65 (-7.82%) |
1.82 |
1.61 - 1.84 |
0.5273 times |
Fri 25 July 2025 |
1.79 (-9.6%) |
1.99 |
1.79 - 2.00 |
1.1099 times |
Fri 18 July 2025 |
1.98 (-1%) |
2.00 |
1.89 - 2.05 |
1.1333 times |
Fri 11 July 2025 |
2.00 (12.99%) |
1.75 |
1.75 - 2.04 |
1.6398 times |
Thu 03 July 2025 |
1.77 (2.31%) |
1.75 |
1.70 - 1.85 |
0.8493 times |
Fri 27 June 2025 |
1.73 (11.61%) |
1.56 |
1.48 - 1.75 |
1.8442 times |
Fri 20 June 2025 |
1.55 (2.65%) |
1.54 |
1.46 - 1.60 |
0.4749 times |
Fri 13 June 2025 |
1.51 (-16.11%) |
1.82 |
1.51 - 1.85 |
1.0191 times |
Fri 06 June 2025 |
1.80 (10.43%) |
1.62 |
1.60 - 1.85 |
0.8039 times |
Fri 30 May 2025 |
1.63 (-1.81%) |
1.70 |
1.54 - 1.70 |
0.5985 times |
Fri 23 May 2025 |
1.66 (-1.78%) |
1.68 |
1.61 - 1.80 |
1.0411 times |
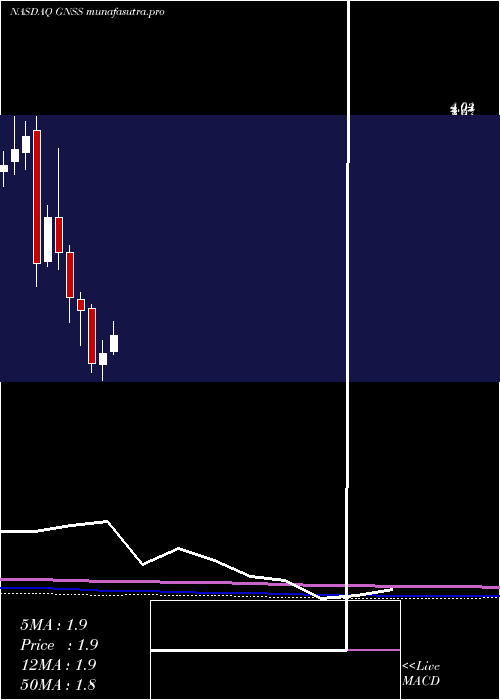
Monthly price and charts GenasysInc Strong monthly Stock price targets for GenasysInc GNSS are 1.41 and 1.85 | Monthly Target 1 | 1.33 | | Monthly Target 2 | 1.49 | | Monthly Target 3 | 1.77 | | Monthly Target 4 | 1.93 | | Monthly Target 5 | 2.21 |
Monthly price and volumes Genasys Inc
| Date |
Closing |
Open |
Range |
Volume |
Wed 30 July 2025 |
1.65 (-4.62%) |
1.74 |
1.61 - 2.05 |
0.8972 times |
Mon 30 June 2025 |
1.73 (6.13%) |
1.62 |
1.46 - 1.85 |
0.7788 times |
Fri 30 May 2025 |
1.63 (-23.83%) |
2.16 |
1.54 - 2.20 |
0.8719 times |
Wed 30 April 2025 |
2.14 (-5.73%) |
2.25 |
1.80 - 2.32 |
0.65 times |
Mon 31 March 2025 |
2.27 (-16.24%) |
2.71 |
2.03 - 2.78 |
1.0661 times |
Fri 28 February 2025 |
2.71 (-11.15%) |
3.05 |
2.54 - 3.73 |
1.5823 times |
Fri 31 January 2025 |
3.05 (17.31%) |
2.62 |
2.57 - 3.17 |
1.198 times |
Tue 31 December 2024 |
2.60 (-32.29%) |
3.90 |
2.38 - 4.04 |
1.451 times |
Tue 26 November 2024 |
3.84 (3.23%) |
3.69 |
3.52 - 3.99 |
0.6117 times |
Thu 31 October 2024 |
3.72 (4.49%) |
3.60 |
3.47 - 4.04 |
0.8928 times |
Mon 30 September 2024 |
3.56 (14.1%) |
3.09 |
2.71 - 3.70 |
0.6941 times |
DMA SMA EMA moving averages of Genasys Inc GNSS
DMA (daily moving average) of Genasys Inc GNSS
| DMA period | DMA value | | 5 day DMA | 1.75 | | 12 day DMA | 1.86 | | 20 day DMA | 1.87 | | 35 day DMA | 1.76 | | 50 day DMA | 1.74 | | 100 day DMA | 1.93 | | 150 day DMA | 2.25 | | 200 day DMA | 2.57 | EMA (exponential moving average) of Genasys Inc GNSS
| EMA period | EMA current | EMA prev | EMA prev2 | | 5 day EMA | 1.74 | 1.78 | 1.84 | | 12 day EMA | 1.8 | 1.83 | 1.86 | | 20 day EMA | 1.81 | 1.83 | 1.85 | | 35 day EMA | 1.8 | 1.81 | 1.82 | | 50 day EMA | 1.74 | 1.74 | 1.74 |
SMA (simple moving average) of Genasys Inc GNSS
| SMA period | SMA current | SMA prev | SMA prev2 | | 5 day SMA | 1.75 | 1.81 | 1.86 | | 12 day SMA | 1.86 | 1.89 | 1.92 | | 20 day SMA | 1.87 | 1.88 | 1.88 | | 35 day SMA | 1.76 | 1.76 | 1.77 | | 50 day SMA | 1.74 | 1.74 | 1.74 | | 100 day SMA | 1.93 | 1.93 | 1.94 | | 150 day SMA | 2.25 | 2.26 | 2.27 | | 200 day SMA | 2.57 | 2.58 | 2.59 |
|
|
