GenprexInc GNPX full analysis,charts,indicators,moving averages,SMA,DMA,EMA,ADX,MACD,RSIGenprex Inc GNPX WideScreen charts, DMA,SMA,EMA technical analysis, forecast prediction, by indicators ADX,MACD,RSI,CCI NASDAQ stock exchange
operates under Health Care sector & deals in Major Pharmaceuticals
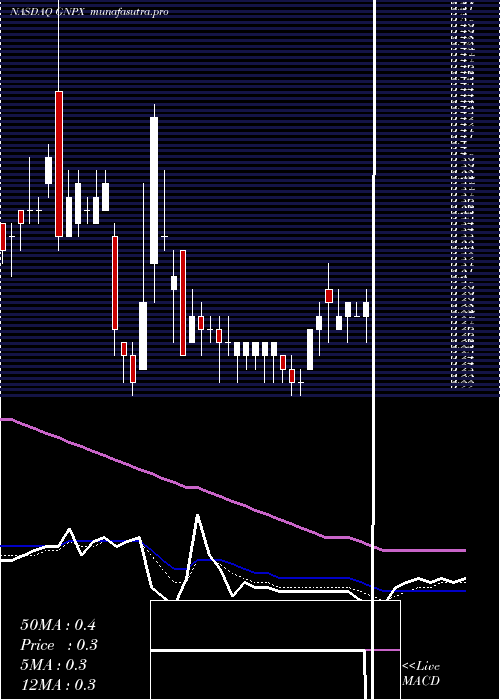
Daily price and charts and targets GenprexInc Strong Daily Stock price targets for GenprexInc GNPX are 0.17 and 0.5 | Daily Target 1 | 0.1 | | Daily Target 2 | 0.23 | | Daily Target 3 | 0.43 | | Daily Target 4 | 0.56 | | Daily Target 5 | 0.76 |
Daily price and volume Genprex Inc
| Date |
Closing |
Open |
Range |
Volume |
Fri 17 October 2025 |
0.36 (-16.28%) |
0.43 |
0.30 - 0.63 |
0.4592 times |
Thu 16 October 2025 |
0.43 (-48.81%) |
0.70 |
0.41 - 0.75 |
0.5016 times |
Wed 15 October 2025 |
0.84 (236%) |
0.48 |
0.46 - 1.10 |
8.3681 times |
Tue 14 October 2025 |
0.25 (31.58%) |
0.21 |
0.20 - 0.26 |
0.4567 times |
Mon 13 October 2025 |
0.19 (-9.52%) |
0.21 |
0.17 - 0.21 |
0.0277 times |
Fri 10 October 2025 |
0.21 (-8.7%) |
0.21 |
0.21 - 0.23 |
0.0276 times |
Thu 09 October 2025 |
0.23 (-4.17%) |
0.24 |
0.22 - 0.28 |
0.0474 times |
Wed 08 October 2025 |
0.24 (20%) |
0.20 |
0.20 - 0.24 |
0.0487 times |
Tue 07 October 2025 |
0.20 (-4.76%) |
0.21 |
0.19 - 0.22 |
0.0477 times |
Mon 06 October 2025 |
0.21 (5%) |
0.19 |
0.18 - 0.21 |
0.0153 times |
Fri 03 October 2025 |
0.20 (0%) |
0.20 |
0.18 - 0.22 |
0.0454 times |
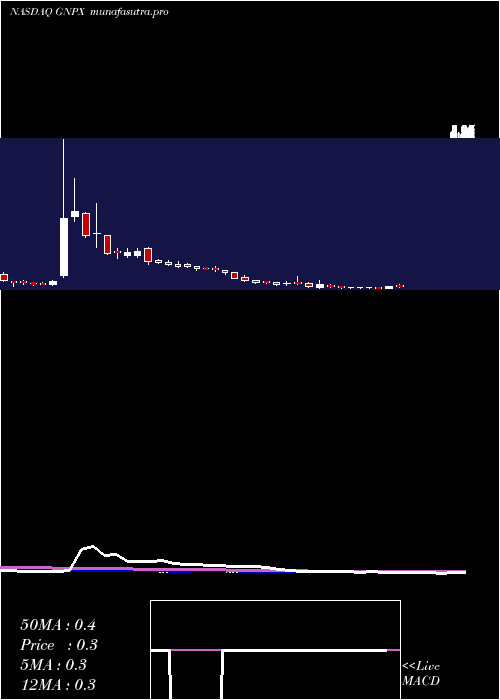
Weekly price and charts GenprexInc Strong weekly Stock price targets for GenprexInc GNPX are 0.27 and 1.2 | Weekly Target 1 | -0.39 | | Weekly Target 2 | -0.01 | | Weekly Target 3 | 0.54333333333333 | | Weekly Target 4 | 0.92 | | Weekly Target 5 | 1.47 |
Weekly price and volumes for Genprex Inc
| Date |
Closing |
Open |
Range |
Volume |
Fri 17 October 2025 |
0.36 (71.43%) |
0.21 |
0.17 - 1.10 |
6.6309 times |
Fri 10 October 2025 |
0.21 (5%) |
0.19 |
0.18 - 0.28 |
0.1262 times |
Fri 03 October 2025 |
0.20 (11.11%) |
0.18 |
0.16 - 0.22 |
0.1182 times |
Fri 26 September 2025 |
0.18 (-21.74%) |
0.22 |
0.18 - 0.24 |
0.0849 times |
Fri 19 September 2025 |
0.23 (-20.69%) |
0.28 |
0.22 - 0.29 |
0.0831 times |
Fri 12 September 2025 |
0.29 (26.09%) |
0.31 |
0.20 - 0.40 |
1.2961 times |
Fri 05 September 2025 |
0.23 (43.75%) |
0.16 |
0.14 - 0.26 |
0.8193 times |
Fri 29 August 2025 |
0.16 (0%) |
0.18 |
0.15 - 0.18 |
0.0166 times |
Fri 29 August 2025 |
0.16 (-5.88%) |
0.18 |
0.15 - 0.18 |
0.1273 times |
Fri 22 August 2025 |
0.17 (-19.05%) |
0.25 |
0.14 - 0.25 |
0.6974 times |
Fri 15 August 2025 |
0.21 (0%) |
0.22 |
0.21 - 0.24 |
0.0304 times |
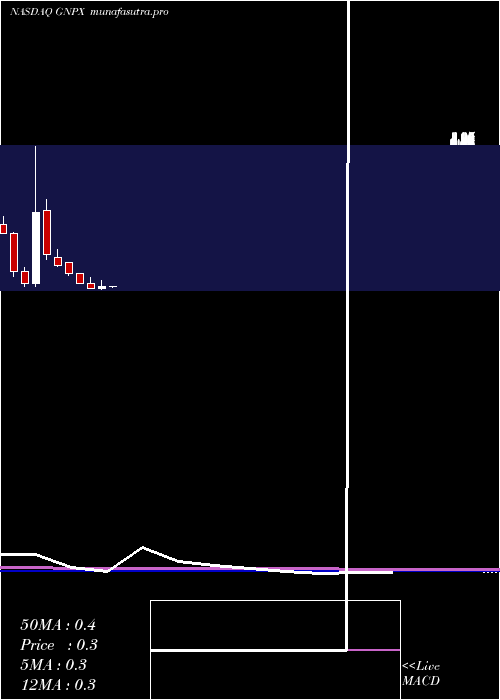
Monthly price and charts GenprexInc Strong monthly Stock price targets for GenprexInc GNPX are 0.27 and 1.2 | Monthly Target 1 | -0.39 | | Monthly Target 2 | -0.01 | | Monthly Target 3 | 0.54333333333333 | | Monthly Target 4 | 0.92 | | Monthly Target 5 | 1.47 |
Monthly price and volumes Genprex Inc
| Date |
Closing |
Open |
Range |
Volume |
Fri 17 October 2025 |
0.36 (111.76%) |
0.18 |
0.17 - 1.10 |
5.4148 times |
Tue 30 September 2025 |
0.17 (6.25%) |
0.16 |
0.14 - 0.40 |
1.8563 times |
Fri 29 August 2025 |
0.16 (-30.43%) |
0.23 |
0.14 - 0.26 |
0.7192 times |
Thu 31 July 2025 |
0.23 (0%) |
0.23 |
0.22 - 0.32 |
0.1159 times |
Mon 30 June 2025 |
0.23 (-30.3%) |
0.33 |
0.20 - 0.35 |
0.3288 times |
Fri 30 May 2025 |
0.33 (13.79%) |
0.28 |
0.22 - 0.37 |
0.2078 times |
Wed 30 April 2025 |
0.29 (16%) |
0.25 |
0.22 - 0.44 |
0.7834 times |
Mon 31 March 2025 |
0.25 (-34.21%) |
0.38 |
0.23 - 0.52 |
0.3799 times |
Fri 28 February 2025 |
0.38 (-38.71%) |
0.62 |
0.36 - 0.62 |
0.1555 times |
Fri 31 January 2025 |
0.62 (-27.06%) |
0.91 |
0.58 - 0.93 |
0.0385 times |
Tue 31 December 2024 |
0.85 (-24.11%) |
1.05 |
0.81 - 1.26 |
0.0597 times |
DMA SMA EMA moving averages of Genprex Inc GNPX
DMA (daily moving average) of Genprex Inc GNPX
| DMA period | DMA value | | 5 day DMA | 0.41 | | 12 day DMA | 0.3 | | 20 day DMA | 0.26 | | 35 day DMA | 0.24 | | 50 day DMA | 0.22 | | 100 day DMA | 0.25 | | 150 day DMA | 0.26 | | 200 day DMA | 0.33 | EMA (exponential moving average) of Genprex Inc GNPX
| EMA period | EMA current | EMA prev | EMA prev2 | | 5 day EMA | 0.41 | 0.43 | 0.43 | | 12 day EMA | 0.34 | 0.34 | 0.32 | | 20 day EMA | 0.3 | 0.29 | 0.28 | | 35 day EMA | 0.27 | 0.26 | 0.25 | | 50 day EMA | 0.24 | 0.24 | 0.23 |
SMA (simple moving average) of Genprex Inc GNPX
| SMA period | SMA current | SMA prev | SMA prev2 | | 5 day SMA | 0.41 | 0.38 | 0.34 | | 12 day SMA | 0.3 | 0.28 | 0.26 | | 20 day SMA | 0.26 | 0.25 | 0.24 | | 35 day SMA | 0.24 | 0.24 | 0.23 | | 50 day SMA | 0.22 | 0.22 | 0.22 | | 100 day SMA | 0.25 | 0.25 | 0.25 | | 150 day SMA | 0.26 | 0.26 | 0.26 | | 200 day SMA | 0.33 | 0.33 | 0.34 |
|
|
