GreenlaneHoldings GNLN full analysis,charts,indicators,moving averages,SMA,DMA,EMA,ADX,MACD,RSIGreenlane Holdings GNLN WideScreen charts, DMA,SMA,EMA technical analysis, forecast prediction, by indicators ADX,MACD,RSI,CCI NASDAQ stock exchange
Daily price and charts and targets GreenlaneHoldings Strong Daily Stock price targets for GreenlaneHoldings GNLN are 3.06 and 3.32 | Daily Target 1 | 2.87 | | Daily Target 2 | 2.98 | | Daily Target 3 | 3.13 | | Daily Target 4 | 3.24 | | Daily Target 5 | 3.39 |
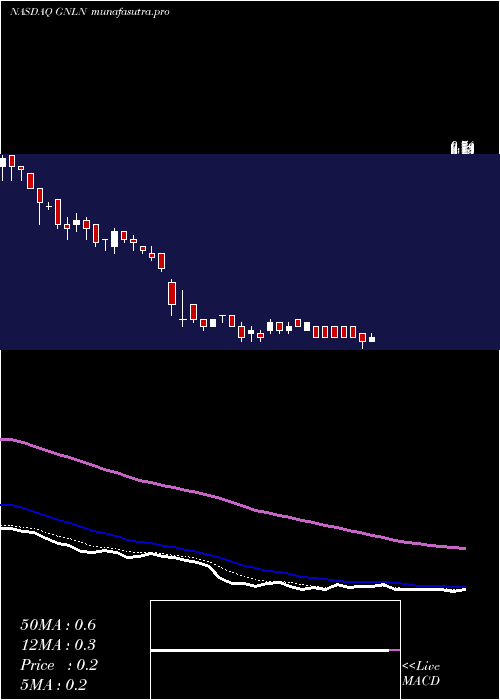
Daily price and volume Greenlane Holdings
| Date |
Closing |
Open |
Range |
Volume |
Fri 11 July 2025 |
3.09 (0.98%) |
3.05 |
3.02 - 3.28 |
0.0493 times |
Thu 10 July 2025 |
3.06 (-4.67%) |
3.26 |
3.05 - 3.29 |
0.0728 times |
Wed 09 July 2025 |
3.21 (-9.58%) |
3.52 |
3.17 - 3.56 |
0.0743 times |
Tue 08 July 2025 |
3.55 (2.9%) |
3.30 |
3.20 - 3.75 |
0.0861 times |
Mon 07 July 2025 |
3.45 (-9.45%) |
3.75 |
3.33 - 3.75 |
0.0632 times |
Thu 03 July 2025 |
3.81 (1.33%) |
3.72 |
3.65 - 3.93 |
0.0767 times |
Wed 02 July 2025 |
3.76 (-14.35%) |
4.36 |
3.64 - 4.42 |
0.4643 times |
Tue 01 July 2025 |
4.39 (-17.17%) |
4.27 |
3.80 - 4.60 |
0.2097 times |
Mon 30 June 2025 |
5.30 (72.08%) |
3.16 |
3.14 - 7.47 |
8.5905 times |
Fri 27 June 2025 |
3.08 (30700%) |
4.51 |
2.86 - 4.70 |
0.3131 times |
Thu 26 June 2025 |
0.01 (0%) |
0.01 |
0.01 - 0.01 |
53.1354 times |
Weekly price and charts GreenlaneHoldings Strong weekly Stock price targets for GreenlaneHoldings GNLN are 2.69 and 3.42 | Weekly Target 1 | 2.56 | | Weekly Target 2 | 2.82 | | Weekly Target 3 | 3.2866666666667 | | Weekly Target 4 | 3.55 | | Weekly Target 5 | 4.02 |
Weekly price and volumes for Greenlane Holdings
| Date |
Closing |
Open |
Range |
Volume |
Fri 11 July 2025 |
3.09 (-18.9%) |
3.75 |
3.02 - 3.75 |
0.0009 times |
Thu 03 July 2025 |
3.81 (23.7%) |
3.16 |
3.14 - 7.47 |
0.0256 times |
Fri 27 June 2025 |
3.08 (30700%) |
0.01 |
0.01 - 4.70 |
0.7443 times |
Fri 20 June 2025 |
0.01 (0%) |
0.01 |
0.01 - 0.01 |
0.7066 times |
Fri 13 June 2025 |
0.01 (0%) |
0.01 |
0.01 - 0.02 |
3.2155 times |
Fri 06 June 2025 |
0.01 (0%) |
0.01 |
0.01 - 0.01 |
0.8119 times |
Fri 30 May 2025 |
0.01 (0%) |
0.01 |
0.01 - 0.01 |
0.7446 times |
Fri 23 May 2025 |
0.01 (0%) |
0.01 |
0.01 - 0.01 |
1.6397 times |
Fri 16 May 2025 |
0.01 (0%) |
0.01 |
0.01 - 0.01 |
0.9118 times |
Fri 09 May 2025 |
0.01 (0%) |
0.01 |
0.01 - 0.01 |
1.1991 times |
Fri 02 May 2025 |
0.01 (0%) |
0.01 |
0.01 - 0.01 |
1.488 times |

Monthly price and charts GreenlaneHoldings Strong monthly Stock price targets for GreenlaneHoldings GNLN are 2.27 and 3.85 | Monthly Target 1 | 1.99 | | Monthly Target 2 | 2.54 | | Monthly Target 3 | 3.57 | | Monthly Target 4 | 4.12 | | Monthly Target 5 | 5.15 |
Monthly price and volumes Greenlane Holdings
| Date |
Closing |
Open |
Range |
Volume |
Fri 11 July 2025 |
3.09 (-41.7%) |
4.27 |
3.02 - 4.60 |
0.0025 times |
Mon 30 June 2025 |
5.30 (52900%) |
0.01 |
0.01 - 7.47 |
4.5335 times |
Fri 30 May 2025 |
0.01 (0%) |
0.01 |
0.01 - 0.01 |
4.3327 times |
Wed 30 April 2025 |
0.01 (-96.3%) |
0.27 |
0.01 - 0.30 |
1.0767 times |
Mon 31 March 2025 |
0.27 (-61.43%) |
0.69 |
0.26 - 0.69 |
0.0041 times |
Fri 28 February 2025 |
0.70 (-50.7%) |
1.42 |
0.67 - 1.60 |
0.004 times |
Fri 31 January 2025 |
1.42 (-13.94%) |
1.62 |
1.35 - 1.79 |
0.0012 times |
Tue 31 December 2024 |
1.65 (-9.84%) |
1.75 |
1.41 - 1.85 |
0.0012 times |
Tue 26 November 2024 |
1.83 (-31.97%) |
2.69 |
1.70 - 3.65 |
0.0063 times |
Thu 31 October 2024 |
2.69 (-45.1%) |
4.99 |
1.95 - 5.30 |
0.0379 times |
Mon 30 September 2024 |
4.90 (-10.26%) |
5.40 |
4.15 - 7.93 |
0.0092 times |

DMA SMA EMA moving averages of Greenlane Holdings GNLN
DMA (daily moving average) of Greenlane Holdings GNLN
| DMA period | DMA value | | 5 day DMA | 3.27 | | 12 day DMA | 3.06 | | 20 day DMA | 1.84 | | 35 day DMA | 1.06 | | 50 day DMA | 0.74 | | 100 day DMA | 0.58 | | 150 day DMA | 0.89 | | 200 day DMA | 1.57 | EMA (exponential moving average) of Greenlane Holdings GNLN
| EMA period | EMA current | EMA prev | EMA prev2 | | 5 day EMA | 3.22 | 3.29 | 3.4 | | 12 day EMA | 2.84 | 2.79 | 2.74 | | 20 day EMA | 2.26 | 2.17 | 2.08 | | 35 day EMA | 1.58 | 1.49 | 1.4 | | 50 day EMA | 0.95 | 0.86 | 0.77 |
SMA (simple moving average) of Greenlane Holdings GNLN
| SMA period | SMA current | SMA prev | SMA prev2 | | 5 day SMA | 3.27 | 3.42 | 3.56 | | 12 day SMA | 3.06 | 2.8 | 2.55 | | 20 day SMA | 1.84 | 1.69 | 1.53 | | 35 day SMA | 1.06 | 0.97 | 0.88 | | 50 day SMA | 0.74 | 0.68 | 0.62 | | 100 day SMA | 0.58 | 0.56 | 0.54 | | 150 day SMA | 0.89 | 0.88 | 0.88 | | 200 day SMA | 1.57 | 1.59 | 1.6 |
|
|
