GreenwichLifesciences GLSI full analysis,charts,indicators,moving averages,SMA,DMA,EMA,ADX,MACD,RSIGreenwich Lifesciences GLSI WideScreen charts, DMA,SMA,EMA technical analysis, forecast prediction, by indicators ADX,MACD,RSI,CCI NASDAQ stock exchange
Daily price and charts and targets GreenwichLifesciences Strong Daily Stock price targets for GreenwichLifesciences GLSI are 8.68 and 9.06 | Daily Target 1 | 8.59 | | Daily Target 2 | 8.77 | | Daily Target 3 | 8.9733333333333 | | Daily Target 4 | 9.15 | | Daily Target 5 | 9.35 |
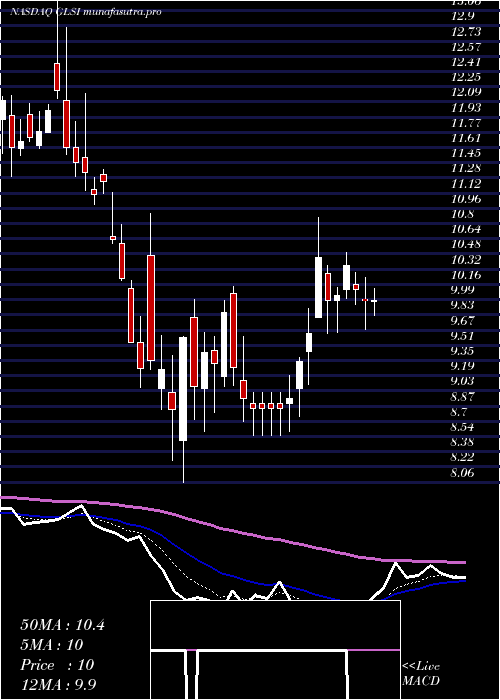
Daily price and volume Greenwich Lifesciences
| Date |
Closing |
Open |
Range |
Volume |
Fri 05 December 2025 |
8.94 (1.59%) |
9.16 |
8.80 - 9.18 |
1.094 times |
Thu 04 December 2025 |
8.80 (4.64%) |
8.43 |
8.30 - 8.85 |
0.712 times |
Wed 03 December 2025 |
8.41 (5.13%) |
8.06 |
8.03 - 8.57 |
1.2498 times |
Tue 02 December 2025 |
8.00 (-2.91%) |
8.25 |
7.97 - 8.33 |
1.0252 times |
Mon 01 December 2025 |
8.24 (-5.61%) |
8.50 |
8.12 - 8.61 |
0.7624 times |
Fri 28 November 2025 |
8.73 (4.55%) |
8.47 |
8.47 - 8.95 |
0.7746 times |
Wed 26 November 2025 |
8.35 (-0.6%) |
8.36 |
8.21 - 8.50 |
1.1322 times |
Tue 25 November 2025 |
8.40 (7.01%) |
7.88 |
7.88 - 8.53 |
0.741 times |
Mon 24 November 2025 |
7.85 (-3.68%) |
8.10 |
7.78 - 8.27 |
1.2773 times |
Fri 21 November 2025 |
8.15 (-0.12%) |
8.17 |
8.05 - 8.41 |
1.2315 times |
Thu 20 November 2025 |
8.16 (0.37%) |
8.22 |
8.11 - 8.55 |
0.8037 times |
Weekly price and charts GreenwichLifesciences Strong weekly Stock price targets for GreenwichLifesciences GLSI are 8.46 and 9.67 | Weekly Target 1 | 7.49 | | Weekly Target 2 | 8.21 | | Weekly Target 3 | 8.6966666666667 | | Weekly Target 4 | 9.42 | | Weekly Target 5 | 9.91 |
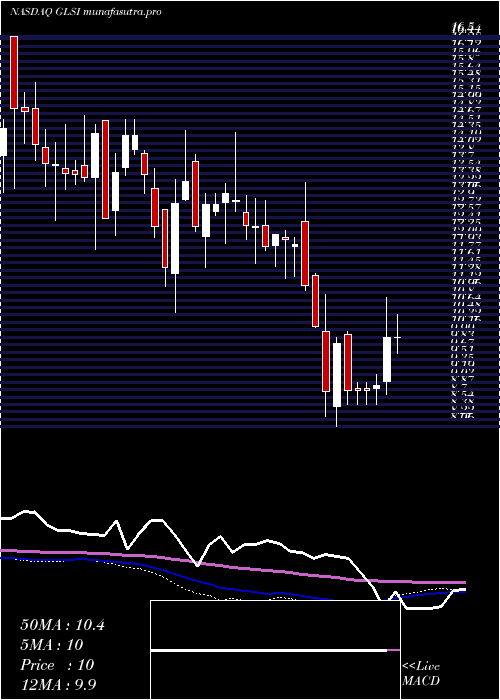
Weekly price and volumes for Greenwich Lifesciences
| Date |
Closing |
Open |
Range |
Volume |
Fri 05 December 2025 |
8.94 (2.41%) |
8.50 |
7.97 - 9.18 |
0.9828 times |
Fri 28 November 2025 |
8.73 (7.12%) |
8.10 |
7.78 - 8.95 |
0.7965 times |
Fri 21 November 2025 |
8.15 (-2.04%) |
8.39 |
8.05 - 8.56 |
0.8647 times |
Fri 14 November 2025 |
8.32 (-3.93%) |
8.83 |
7.94 - 9.14 |
1.6063 times |
Fri 07 November 2025 |
8.66 (-5.97%) |
8.71 |
7.88 - 9.10 |
1.539 times |
Fri 31 October 2025 |
9.21 (0%) |
9.15 |
9.10 - 9.51 |
0.1253 times |
Fri 31 October 2025 |
9.21 (-7.81%) |
10.02 |
9.10 - 10.22 |
0.6067 times |
Fri 24 October 2025 |
9.99 (5.27%) |
9.50 |
8.90 - 10.00 |
1.2287 times |
Fri 17 October 2025 |
9.49 (-10.89%) |
10.90 |
9.45 - 11.02 |
1.2207 times |
Fri 10 October 2025 |
10.65 (-2.38%) |
10.92 |
10.59 - 11.49 |
1.0293 times |
Fri 03 October 2025 |
10.91 (4.9%) |
10.38 |
9.73 - 11.13 |
0.773 times |
Monthly price and charts GreenwichLifesciences Strong monthly Stock price targets for GreenwichLifesciences GLSI are 8.46 and 9.67 | Monthly Target 1 | 7.49 | | Monthly Target 2 | 8.21 | | Monthly Target 3 | 8.6966666666667 | | Monthly Target 4 | 9.42 | | Monthly Target 5 | 9.91 |
Monthly price and volumes Greenwich Lifesciences
| Date |
Closing |
Open |
Range |
Volume |
Fri 05 December 2025 |
8.94 (2.41%) |
8.50 |
7.97 - 9.18 |
0.2454 times |
Fri 28 November 2025 |
8.73 (-5.21%) |
8.71 |
7.78 - 9.14 |
1.2001 times |
Fri 31 October 2025 |
9.21 (-7.44%) |
9.97 |
8.90 - 11.49 |
1.147 times |
Tue 30 September 2025 |
9.95 (-13.33%) |
11.60 |
9.73 - 13.00 |
1.4184 times |
Fri 29 August 2025 |
11.48 (4.94%) |
10.90 |
10.70 - 12.88 |
0.7052 times |
Thu 31 July 2025 |
10.94 (20.62%) |
9.09 |
8.97 - 12.54 |
1.3105 times |
Mon 30 June 2025 |
9.07 (-7.92%) |
9.90 |
8.65 - 10.00 |
0.5792 times |
Fri 30 May 2025 |
9.85 (-2.48%) |
10.00 |
9.20 - 10.61 |
0.6037 times |
Wed 30 April 2025 |
10.10 (5.87%) |
9.54 |
8.06 - 10.91 |
2.3716 times |
Mon 31 March 2025 |
9.54 (-21.93%) |
12.14 |
9.54 - 13.33 |
0.4187 times |
Fri 28 February 2025 |
12.22 (-5.56%) |
12.70 |
11.52 - 13.05 |
0.2966 times |

DMA SMA EMA moving averages of Greenwich Lifesciences GLSI
DMA (daily moving average) of Greenwich Lifesciences GLSI
| DMA period | DMA value | | 5 day DMA | 8.48 | | 12 day DMA | 8.35 | | 20 day DMA | 8.36 | | 35 day DMA | 8.69 | | 50 day DMA | 9.26 | | 100 day DMA | 10.41 | | 150 day DMA | 10.17 | | 200 day DMA | 10.26 | EMA (exponential moving average) of Greenwich Lifesciences GLSI
| EMA period | EMA current | EMA prev | EMA prev2 | | 5 day EMA | 8.62 | 8.46 | 8.29 | | 12 day EMA | 8.47 | 8.39 | 8.32 | | 20 day EMA | 8.53 | 8.49 | 8.46 | | 35 day EMA | 8.9 | 8.9 | 8.91 | | 50 day EMA | 9.33 | 9.35 | 9.37 |
SMA (simple moving average) of Greenwich Lifesciences GLSI
| SMA period | SMA current | SMA prev | SMA prev2 | | 5 day SMA | 8.48 | 8.44 | 8.35 | | 12 day SMA | 8.35 | 8.29 | 8.24 | | 20 day SMA | 8.36 | 8.33 | 8.3 | | 35 day SMA | 8.69 | 8.71 | 8.76 | | 50 day SMA | 9.26 | 9.29 | 9.33 | | 100 day SMA | 10.41 | 10.43 | 10.44 | | 150 day SMA | 10.17 | 10.17 | 10.18 | | 200 day SMA | 10.26 | 10.28 | 10.3 |
|
|
