GreenlightReinsurance GLRE full analysis,charts,indicators,moving averages,SMA,DMA,EMA,ADX,MACD,RSIGreenlight Reinsurance GLRE WideScreen charts, DMA,SMA,EMA technical analysis, forecast prediction, by indicators ADX,MACD,RSI,CCI NASDAQ stock exchange
operates under Finance sector & deals in Property Casualty Insurers
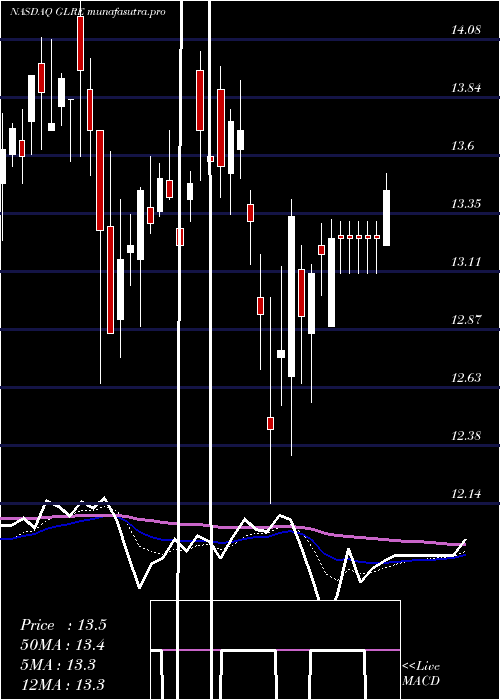
Daily price and charts and targets GreenlightReinsurance Strong Daily Stock price targets for GreenlightReinsurance GLRE are 13.2 and 13.41 | Daily Target 1 | 13.16 | | Daily Target 2 | 13.24 | | Daily Target 3 | 13.373333333333 | | Daily Target 4 | 13.45 | | Daily Target 5 | 13.58 |
Daily price and volume Greenlight Reinsurance
| Date |
Closing |
Open |
Range |
Volume |
Fri 11 July 2025 |
13.31 (-1.7%) |
13.50 |
13.30 - 13.51 |
0.5459 times |
Thu 10 July 2025 |
13.54 (-2.17%) |
13.77 |
13.52 - 13.82 |
0.3996 times |
Wed 09 July 2025 |
13.84 (0.73%) |
13.78 |
13.59 - 14.15 |
0.5383 times |
Tue 08 July 2025 |
13.74 (-1.22%) |
13.88 |
13.72 - 13.98 |
0.9589 times |
Mon 07 July 2025 |
13.91 (-2.86%) |
14.33 |
13.91 - 14.33 |
0.3545 times |
Thu 03 July 2025 |
14.32 (1.2%) |
14.13 |
14.13 - 14.40 |
0.2133 times |
Wed 02 July 2025 |
14.15 (-1.46%) |
14.33 |
14.06 - 14.34 |
0.5516 times |
Tue 01 July 2025 |
14.36 (-0.07%) |
14.37 |
14.30 - 14.56 |
0.3331 times |
Mon 30 June 2025 |
14.37 (-0.42%) |
14.51 |
14.27 - 14.51 |
5.1692 times |
Fri 27 June 2025 |
14.43 (-1.16%) |
14.56 |
14.26 - 14.68 |
0.9356 times |
Thu 26 June 2025 |
14.60 (0.62%) |
14.51 |
14.48 - 14.68 |
0.3706 times |
Weekly price and charts GreenlightReinsurance Strong weekly Stock price targets for GreenlightReinsurance GLRE are 12.79 and 13.82 | Weekly Target 1 | 12.62 | | Weekly Target 2 | 12.96 | | Weekly Target 3 | 13.646666666667 | | Weekly Target 4 | 13.99 | | Weekly Target 5 | 14.68 |
Weekly price and volumes for Greenlight Reinsurance
| Date |
Closing |
Open |
Range |
Volume |
Fri 11 July 2025 |
13.31 (-7.05%) |
14.33 |
13.30 - 14.33 |
0.9905 times |
Thu 03 July 2025 |
14.32 (-0.76%) |
14.51 |
14.06 - 14.56 |
2.2192 times |
Fri 27 June 2025 |
14.43 (0.21%) |
14.40 |
14.26 - 15.03 |
1.1878 times |
Fri 20 June 2025 |
14.40 (-0.89%) |
14.53 |
14.35 - 14.65 |
0.7001 times |
Fri 13 June 2025 |
14.53 (0.9%) |
14.55 |
14.48 - 15.07 |
1.0864 times |
Fri 06 June 2025 |
14.40 (-0.28%) |
14.44 |
14.00 - 14.60 |
0.7443 times |
Fri 30 May 2025 |
14.44 (6.96%) |
13.57 |
13.51 - 14.65 |
0.6595 times |
Fri 23 May 2025 |
13.50 (-0.59%) |
13.50 |
13.33 - 13.75 |
0.8995 times |
Fri 16 May 2025 |
13.58 (0.07%) |
13.72 |
13.11 - 14.42 |
0.8216 times |
Fri 09 May 2025 |
13.57 (2.73%) |
13.39 |
13.11 - 13.65 |
0.6912 times |
Fri 02 May 2025 |
13.21 (0.99%) |
13.02 |
12.95 - 13.36 |
0.6631 times |

Monthly price and charts GreenlightReinsurance Strong monthly Stock price targets for GreenlightReinsurance GLRE are 12.68 and 13.94 | Monthly Target 1 | 12.46 | | Monthly Target 2 | 12.89 | | Monthly Target 3 | 13.723333333333 | | Monthly Target 4 | 14.15 | | Monthly Target 5 | 14.98 |
Monthly price and volumes Greenlight Reinsurance
| Date |
Closing |
Open |
Range |
Volume |
Fri 11 July 2025 |
13.31 (-7.38%) |
14.37 |
13.30 - 14.56 |
0.4493 times |
Mon 30 June 2025 |
14.37 (-0.48%) |
14.44 |
14.00 - 15.07 |
1.8074 times |
Fri 30 May 2025 |
14.44 (10.06%) |
13.05 |
12.96 - 14.65 |
1.0799 times |
Wed 30 April 2025 |
13.12 (-3.17%) |
13.52 |
12.14 - 13.91 |
1.0373 times |
Mon 31 March 2025 |
13.55 (-2.73%) |
13.98 |
12.64 - 14.31 |
1.1749 times |
Fri 28 February 2025 |
13.93 (3.19%) |
13.34 |
13.03 - 13.99 |
0.8107 times |
Fri 31 January 2025 |
13.50 (-3.57%) |
14.07 |
13.34 - 14.31 |
0.9651 times |
Tue 31 December 2024 |
14.00 (-6.85%) |
14.95 |
13.49 - 15.02 |
0.6156 times |
Tue 26 November 2024 |
15.03 (11.5%) |
13.54 |
13.13 - 15.82 |
1.2586 times |
Thu 31 October 2024 |
13.48 (-1.25%) |
13.65 |
13.18 - 14.00 |
0.8013 times |
Mon 30 September 2024 |
13.65 (-2.29%) |
13.84 |
13.35 - 14.31 |
1.2931 times |

DMA SMA EMA moving averages of Greenlight Reinsurance GLRE
DMA (daily moving average) of Greenlight Reinsurance GLRE
| DMA period | DMA value | | 5 day DMA | 13.67 | | 12 day DMA | 14.09 | | 20 day DMA | 14.3 | | 35 day DMA | 14.24 | | 50 day DMA | 13.97 | | 100 day DMA | 13.68 | | 150 day DMA | 13.76 | | 200 day DMA | 13.82 | EMA (exponential moving average) of Greenlight Reinsurance GLRE
| EMA period | EMA current | EMA prev | EMA prev2 | | 5 day EMA | 13.66 | 13.83 | 13.98 | | 12 day EMA | 13.97 | 14.09 | 14.19 | | 20 day EMA | 14.09 | 14.17 | 14.24 | | 35 day EMA | 14.02 | 14.06 | 14.09 | | 50 day EMA | 13.89 | 13.91 | 13.92 |
SMA (simple moving average) of Greenlight Reinsurance GLRE
| SMA period | SMA current | SMA prev | SMA prev2 | | 5 day SMA | 13.67 | 13.87 | 13.99 | | 12 day SMA | 14.09 | 14.22 | 14.32 | | 20 day SMA | 14.3 | 14.38 | 14.45 | | 35 day SMA | 14.24 | 14.25 | 14.25 | | 50 day SMA | 13.97 | 13.97 | 13.96 | | 100 day SMA | 13.68 | 13.68 | 13.68 | | 150 day SMA | 13.76 | 13.77 | 13.78 | | 200 day SMA | 13.82 | 13.83 | 13.83 |
|
|
