GevoInc GEVO full analysis,charts,indicators,moving averages,SMA,DMA,EMA,ADX,MACD,RSIGevo Inc GEVO WideScreen charts, DMA,SMA,EMA technical analysis, forecast prediction, by indicators ADX,MACD,RSI,CCI NASDAQ stock exchange
operates under Basic Industries sector & deals in Major Chemicals
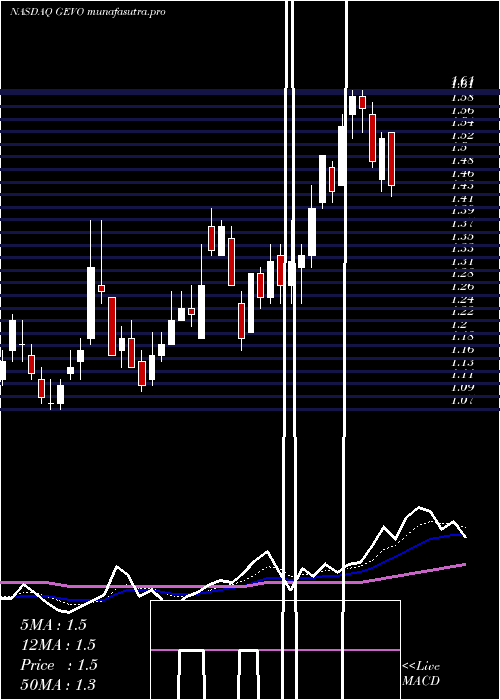
Daily price and charts and targets GevoInc Strong Daily Stock price targets for GevoInc GEVO are 2.25 and 2.35 | Daily Target 1 | 2.23 | | Daily Target 2 | 2.26 | | Daily Target 3 | 2.3266666666667 | | Daily Target 4 | 2.36 | | Daily Target 5 | 2.43 |
Daily price and volume Gevo Inc
| Date |
Closing |
Open |
Range |
Volume |
Fri 05 December 2025 |
2.30 (-2.95%) |
2.35 |
2.29 - 2.39 |
0.6872 times |
Thu 04 December 2025 |
2.37 (1.72%) |
2.30 |
2.28 - 2.42 |
1.0225 times |
Wed 03 December 2025 |
2.33 (7.37%) |
2.18 |
2.16 - 2.34 |
1.265 times |
Tue 02 December 2025 |
2.17 (1.88%) |
2.15 |
2.12 - 2.19 |
0.709 times |
Mon 01 December 2025 |
2.13 (-0.47%) |
2.12 |
2.08 - 2.17 |
1.1696 times |
Fri 28 November 2025 |
2.14 (1.9%) |
2.09 |
2.06 - 2.15 |
0.5336 times |
Wed 26 November 2025 |
2.10 (0.96%) |
2.08 |
2.03 - 2.10 |
0.9973 times |
Tue 25 November 2025 |
2.08 (1.96%) |
2.03 |
1.96 - 2.08 |
0.9944 times |
Mon 24 November 2025 |
2.04 (5.15%) |
1.94 |
1.87 - 2.04 |
1.1719 times |
Fri 21 November 2025 |
1.94 (3.74%) |
1.87 |
1.83 - 1.96 |
1.4496 times |
Thu 20 November 2025 |
1.87 (-3.61%) |
1.98 |
1.86 - 2.04 |
1.4119 times |
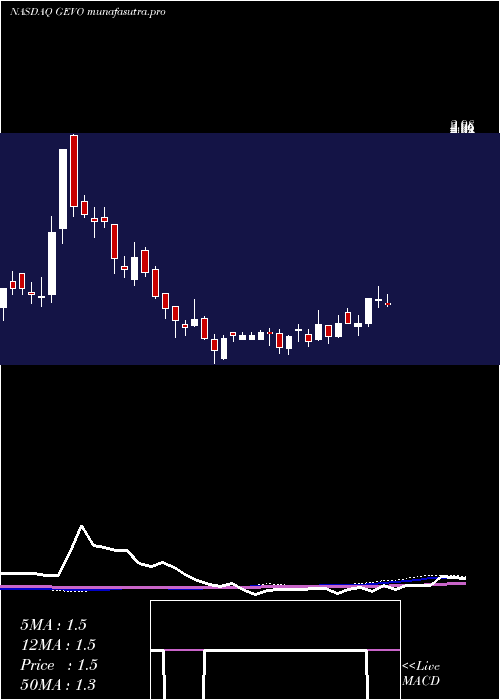
Weekly price and charts GevoInc Strong weekly Stock price targets for GevoInc GEVO are 2.19 and 2.53 | Weekly Target 1 | 1.93 | | Weekly Target 2 | 2.11 | | Weekly Target 3 | 2.2666666666667 | | Weekly Target 4 | 2.45 | | Weekly Target 5 | 2.61 |
Weekly price and volumes for Gevo Inc
| Date |
Closing |
Open |
Range |
Volume |
Fri 05 December 2025 |
2.30 (7.48%) |
2.12 |
2.08 - 2.42 |
0.5668 times |
Fri 28 November 2025 |
2.14 (10.31%) |
1.94 |
1.87 - 2.15 |
0.4318 times |
Fri 21 November 2025 |
1.94 (-1.52%) |
1.94 |
1.83 - 2.04 |
0.8603 times |
Fri 14 November 2025 |
1.97 (-10.45%) |
2.27 |
1.83 - 2.27 |
1.0291 times |
Fri 07 November 2025 |
2.20 (-5.98%) |
2.17 |
1.95 - 2.25 |
0.7692 times |
Fri 31 October 2025 |
2.34 (0%) |
2.26 |
2.26 - 2.36 |
0.1607 times |
Fri 31 October 2025 |
2.34 (-5.26%) |
2.50 |
2.24 - 2.52 |
0.9093 times |
Fri 24 October 2025 |
2.47 (-1.2%) |
2.50 |
2.26 - 2.74 |
1.2422 times |
Fri 17 October 2025 |
2.50 (14.16%) |
2.20 |
2.20 - 2.95 |
2.533 times |
Fri 10 October 2025 |
2.19 (2.34%) |
2.14 |
2.14 - 2.37 |
1.4978 times |
Fri 03 October 2025 |
2.14 (3.88%) |
2.07 |
1.92 - 2.19 |
1.1916 times |
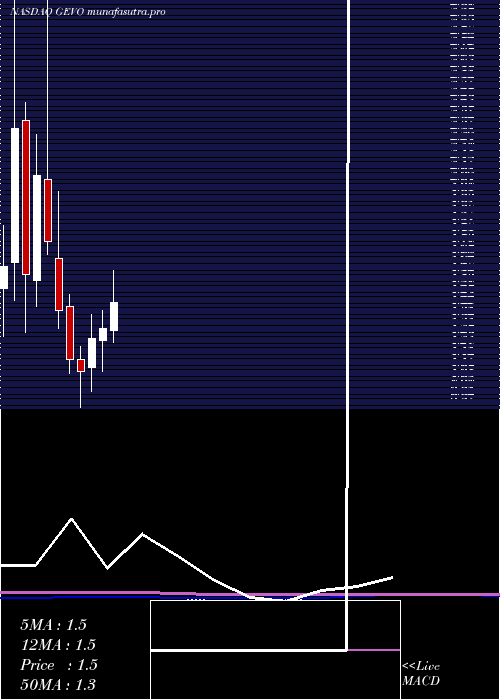
Monthly price and charts GevoInc Strong monthly Stock price targets for GevoInc GEVO are 2.19 and 2.53 | Monthly Target 1 | 1.93 | | Monthly Target 2 | 2.11 | | Monthly Target 3 | 2.2666666666667 | | Monthly Target 4 | 2.45 | | Monthly Target 5 | 2.61 |
Monthly price and volumes Gevo Inc
| Date |
Closing |
Open |
Range |
Volume |
Fri 05 December 2025 |
2.30 (7.48%) |
2.12 |
2.08 - 2.42 |
0.1323 times |
Fri 28 November 2025 |
2.14 (-8.55%) |
2.17 |
1.83 - 2.27 |
0.7215 times |
Fri 31 October 2025 |
2.34 (19.39%) |
1.95 |
1.92 - 2.95 |
1.6646 times |
Tue 30 September 2025 |
1.96 (13.29%) |
1.68 |
1.57 - 2.26 |
1.3859 times |
Fri 29 August 2025 |
1.73 (33.08%) |
1.29 |
1.12 - 2.15 |
2.164 times |
Thu 31 July 2025 |
1.30 (-1.52%) |
1.31 |
1.25 - 1.61 |
0.751 times |
Mon 30 June 2025 |
1.32 (3.94%) |
1.26 |
1.10 - 1.41 |
1.1167 times |
Fri 30 May 2025 |
1.27 (15.45%) |
1.12 |
1.00 - 1.39 |
0.8043 times |
Wed 30 April 2025 |
1.10 (-5.17%) |
1.16 |
0.92 - 1.23 |
0.5599 times |
Mon 31 March 2025 |
1.16 (-17.73%) |
1.43 |
1.09 - 1.49 |
0.6997 times |
Fri 28 February 2025 |
1.41 (-19.89%) |
1.67 |
1.32 - 2.01 |
1.0903 times |
DMA SMA EMA moving averages of Gevo Inc GEVO
DMA (daily moving average) of Gevo Inc GEVO
| DMA period | DMA value | | 5 day DMA | 2.26 | | 12 day DMA | 2.12 | | 20 day DMA | 2.09 | | 35 day DMA | 2.2 | | 50 day DMA | 2.21 | | 100 day DMA | 1.93 | | 150 day DMA | 1.7 | | 200 day DMA | 1.59 | EMA (exponential moving average) of Gevo Inc GEVO
| EMA period | EMA current | EMA prev | EMA prev2 | | 5 day EMA | 2.27 | 2.25 | 2.19 | | 12 day EMA | 2.19 | 2.17 | 2.13 | | 20 day EMA | 2.16 | 2.14 | 2.12 | | 35 day EMA | 2.15 | 2.14 | 2.13 | | 50 day EMA | 2.2 | 2.2 | 2.19 |
SMA (simple moving average) of Gevo Inc GEVO
| SMA period | SMA current | SMA prev | SMA prev2 | | 5 day SMA | 2.26 | 2.23 | 2.17 | | 12 day SMA | 2.12 | 2.09 | 2.05 | | 20 day SMA | 2.09 | 2.08 | 2.07 | | 35 day SMA | 2.2 | 2.21 | 2.21 | | 50 day SMA | 2.21 | 2.2 | 2.2 | | 100 day SMA | 1.93 | 1.92 | 1.91 | | 150 day SMA | 1.7 | 1.7 | 1.69 | | 200 day SMA | 1.59 | 1.58 | 1.58 |
|
|
