GdsHoldings GDS full analysis,charts,indicators,moving averages,SMA,DMA,EMA,ADX,MACD,RSIGds Holdings GDS WideScreen charts, DMA,SMA,EMA technical analysis, forecast prediction, by indicators ADX,MACD,RSI,CCI NASDAQ stock exchange
operates under Technology sector & deals in Computer Software Programming Data Processing
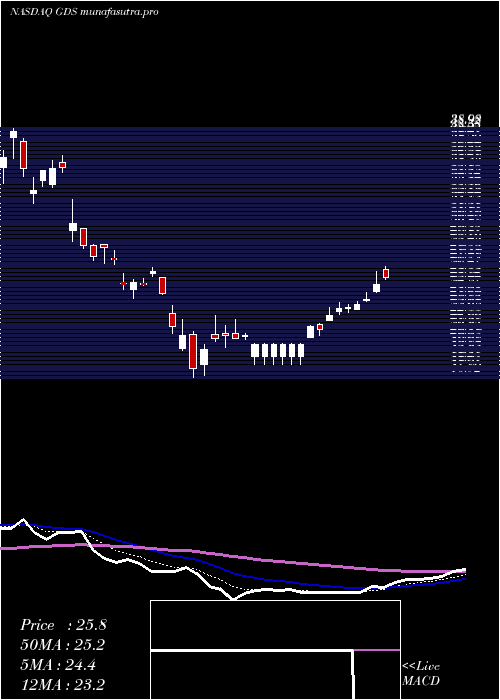
Daily price and charts and targets GdsHoldings Strong Daily Stock price targets for GdsHoldings GDS are 34.78 and 35.91 | Daily Target 1 | 33.88 | | Daily Target 2 | 34.55 | | Daily Target 3 | 35.013333333333 | | Daily Target 4 | 35.68 | | Daily Target 5 | 36.14 |
Daily price and volume Gds Holdings
| Date |
Closing |
Open |
Range |
Volume |
Fri 05 December 2025 |
35.21 (4.23%) |
34.35 |
34.35 - 35.48 |
0.9153 times |
Thu 04 December 2025 |
33.78 (0.12%) |
34.16 |
33.73 - 34.60 |
0.3382 times |
Wed 03 December 2025 |
33.74 (-0.18%) |
33.36 |
33.09 - 33.77 |
0.6254 times |
Tue 02 December 2025 |
33.80 (-2.37%) |
34.17 |
33.58 - 34.25 |
0.7888 times |
Mon 01 December 2025 |
34.62 (1.91%) |
33.59 |
33.46 - 35.04 |
0.9293 times |
Fri 28 November 2025 |
33.97 (-0.38%) |
34.12 |
33.39 - 34.30 |
0.8243 times |
Wed 26 November 2025 |
34.10 (0.09%) |
34.09 |
33.88 - 34.53 |
1.1417 times |
Tue 25 November 2025 |
34.07 (1.55%) |
33.51 |
33.20 - 34.20 |
1.5051 times |
Mon 24 November 2025 |
33.55 (8.51%) |
30.72 |
30.62 - 33.57 |
1.4149 times |
Fri 21 November 2025 |
30.92 (2.08%) |
30.17 |
29.40 - 32.35 |
1.5172 times |
Thu 20 November 2025 |
30.29 (1.82%) |
31.07 |
29.65 - 32.09 |
1.9221 times |
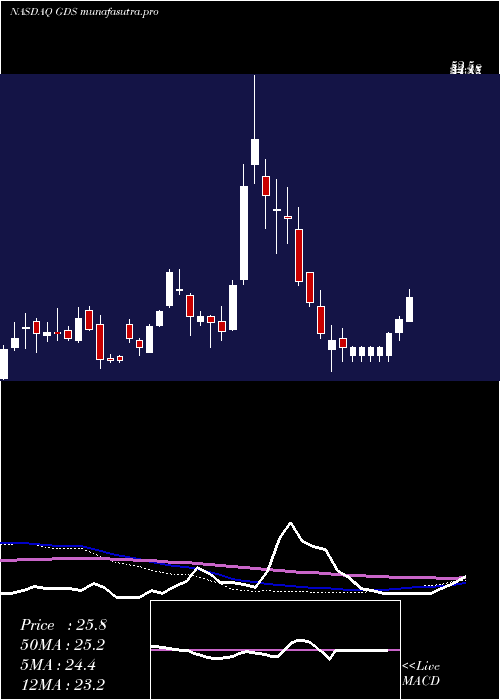
Weekly price and charts GdsHoldings Strong weekly Stock price targets for GdsHoldings GDS are 34.15 and 36.54 | Weekly Target 1 | 32.2 | | Weekly Target 2 | 33.71 | | Weekly Target 3 | 34.593333333333 | | Weekly Target 4 | 36.1 | | Weekly Target 5 | 36.98 |
Weekly price and volumes for Gds Holdings
| Date |
Closing |
Open |
Range |
Volume |
Fri 05 December 2025 |
35.21 (3.65%) |
33.59 |
33.09 - 35.48 |
0.6514 times |
Fri 28 November 2025 |
33.97 (9.86%) |
30.72 |
30.62 - 34.53 |
0.8848 times |
Fri 21 November 2025 |
30.92 (4.25%) |
29.94 |
26.97 - 32.35 |
1.627 times |
Fri 14 November 2025 |
29.66 (-9.68%) |
33.52 |
29.12 - 34.00 |
0.893 times |
Fri 07 November 2025 |
32.84 (-8.01%) |
33.76 |
32.18 - 35.18 |
0.6066 times |
Fri 31 October 2025 |
35.70 (0%) |
35.39 |
35.20 - 36.16 |
0.0911 times |
Fri 31 October 2025 |
35.70 (2.38%) |
36.10 |
35.20 - 38.35 |
0.9244 times |
Fri 24 October 2025 |
34.87 (6.28%) |
33.30 |
32.85 - 35.93 |
0.8281 times |
Fri 17 October 2025 |
32.81 (-1.5%) |
35.52 |
32.07 - 36.23 |
1.3583 times |
Fri 10 October 2025 |
33.31 (-15.8%) |
39.80 |
33.26 - 40.44 |
2.1354 times |
Fri 03 October 2025 |
39.56 (-1.3%) |
41.84 |
38.54 - 43.88 |
1.9464 times |
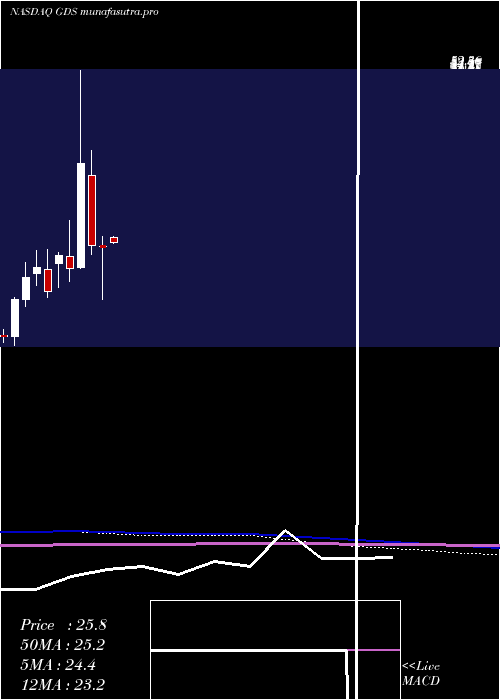
Monthly price and charts GdsHoldings Strong monthly Stock price targets for GdsHoldings GDS are 34.15 and 36.54 | Monthly Target 1 | 32.2 | | Monthly Target 2 | 33.71 | | Monthly Target 3 | 34.593333333333 | | Monthly Target 4 | 36.1 | | Monthly Target 5 | 36.98 |
Monthly price and volumes Gds Holdings
| Date |
Closing |
Open |
Range |
Volume |
Fri 05 December 2025 |
35.21 (3.65%) |
33.59 |
33.09 - 35.48 |
0.0982 times |
Fri 28 November 2025 |
33.97 (-4.85%) |
33.76 |
26.97 - 35.18 |
0.6044 times |
Fri 31 October 2025 |
35.70 (-7.75%) |
39.28 |
32.07 - 43.88 |
0.9715 times |
Tue 30 September 2025 |
38.70 (11.98%) |
32.79 |
32.14 - 43.94 |
1.5751 times |
Fri 29 August 2025 |
34.56 (-4.19%) |
34.68 |
30.53 - 39.00 |
1.1173 times |
Thu 31 July 2025 |
36.07 (17.99%) |
30.41 |
29.00 - 39.68 |
0.9996 times |
Mon 30 June 2025 |
30.57 (29.04%) |
24.35 |
23.67 - 30.95 |
0.6253 times |
Fri 30 May 2025 |
23.69 (-6.03%) |
26.50 |
22.53 - 30.67 |
1.0363 times |
Wed 30 April 2025 |
25.21 (-0.47%) |
25.22 |
16.92 - 26.66 |
1.2976 times |
Mon 31 March 2025 |
25.33 (-33.43%) |
36.22 |
23.91 - 40.00 |
1.6747 times |
Fri 28 February 2025 |
38.05 (75.26%) |
21.91 |
21.75 - 52.50 |
1.9233 times |
DMA SMA EMA moving averages of Gds Holdings GDS
DMA (daily moving average) of Gds Holdings GDS
| DMA period | DMA value | | 5 day DMA | 34.23 | | 12 day DMA | 33.15 | | 20 day DMA | 32.4 | | 35 day DMA | 33.41 | | 50 day DMA | 34.66 | | 100 day DMA | 35.14 | | 150 day DMA | 32.91 | | 200 day DMA | 31.61 | EMA (exponential moving average) of Gds Holdings GDS
| EMA period | EMA current | EMA prev | EMA prev2 | | 5 day EMA | 34.24 | 33.75 | 33.74 | | 12 day EMA | 33.54 | 33.24 | 33.14 | | 20 day EMA | 33.4 | 33.21 | 33.15 | | 35 day EMA | 34.03 | 33.96 | 33.97 | | 50 day EMA | 35.05 | 35.04 | 35.09 |
SMA (simple moving average) of Gds Holdings GDS
| SMA period | SMA current | SMA prev | SMA prev2 | | 5 day SMA | 34.23 | 33.98 | 34.05 | | 12 day SMA | 33.15 | 32.63 | 32.27 | | 20 day SMA | 32.4 | 32.34 | 32.36 | | 35 day SMA | 33.41 | 33.36 | 33.36 | | 50 day SMA | 34.66 | 34.8 | 34.94 | | 100 day SMA | 35.14 | 35.17 | 35.21 | | 150 day SMA | 32.91 | 32.85 | 32.79 | | 200 day SMA | 31.61 | 31.66 | 31.73 |
|
|
