GoodrxHoldings GDRX full analysis,charts,indicators,moving averages,SMA,DMA,EMA,ADX,MACD,RSIGoodrx Holdings GDRX WideScreen charts, DMA,SMA,EMA technical analysis, forecast prediction, by indicators ADX,MACD,RSI,CCI NASDAQ stock exchange
Daily price and charts and targets GoodrxHoldings Strong Daily Stock price targets for GoodrxHoldings GDRX are 2.65 and 2.75 | Daily Target 1 | 2.62 | | Daily Target 2 | 2.67 | | Daily Target 3 | 2.7233333333333 | | Daily Target 4 | 2.77 | | Daily Target 5 | 2.82 |
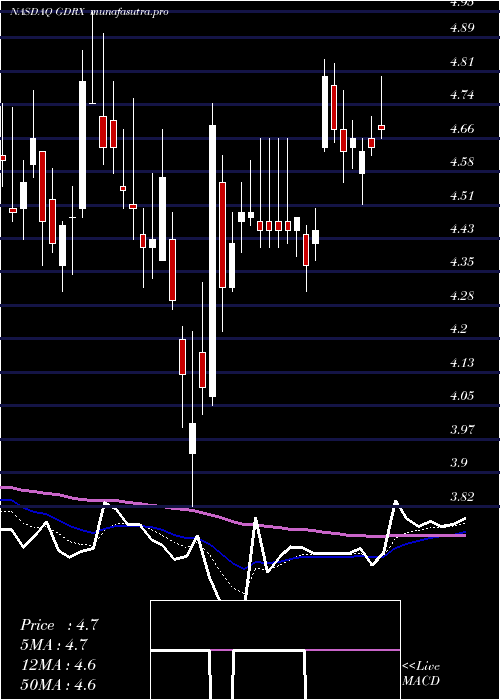
Daily price and volume Goodrx Holdings
| Date |
Closing |
Open |
Range |
Volume |
Fri 05 December 2025 |
2.71 (-1.45%) |
2.77 |
2.68 - 2.78 |
0.74 times |
Thu 04 December 2025 |
2.75 (0.36%) |
2.74 |
2.71 - 2.78 |
0.7032 times |
Wed 03 December 2025 |
2.74 (2.62%) |
2.69 |
2.69 - 2.78 |
1.1887 times |
Tue 02 December 2025 |
2.67 (-2.55%) |
2.78 |
2.66 - 2.78 |
1.1277 times |
Mon 01 December 2025 |
2.74 (-2.49%) |
2.80 |
2.73 - 2.82 |
1.1772 times |
Fri 28 November 2025 |
2.81 (-0.71%) |
2.83 |
2.81 - 2.87 |
0.7355 times |
Wed 26 November 2025 |
2.83 (0.71%) |
2.81 |
2.79 - 2.86 |
0.9021 times |
Tue 25 November 2025 |
2.81 (1.08%) |
2.76 |
2.74 - 2.85 |
1.2556 times |
Mon 24 November 2025 |
2.78 (2.58%) |
2.72 |
2.69 - 2.80 |
1.2413 times |
Fri 21 November 2025 |
2.71 (3.44%) |
2.61 |
2.61 - 2.76 |
0.9287 times |
Thu 20 November 2025 |
2.62 (-2.6%) |
2.73 |
2.61 - 2.78 |
1.0337 times |
Weekly price and charts GoodrxHoldings Strong weekly Stock price targets for GoodrxHoldings GDRX are 2.61 and 2.77 | Weekly Target 1 | 2.57 | | Weekly Target 2 | 2.64 | | Weekly Target 3 | 2.73 | | Weekly Target 4 | 2.8 | | Weekly Target 5 | 2.89 |
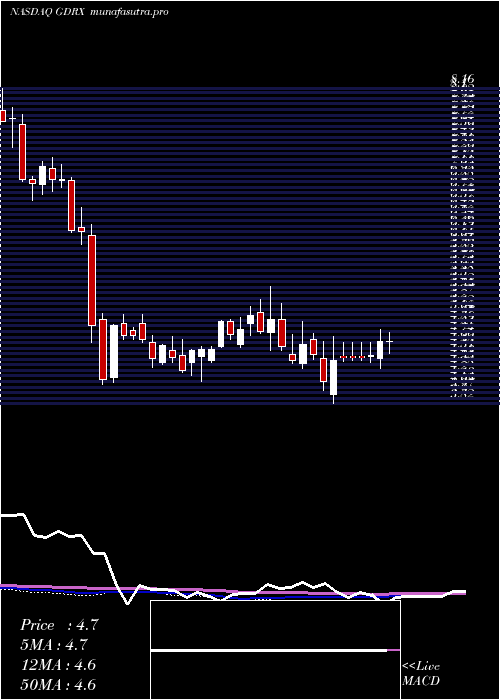
Weekly price and volumes for Goodrx Holdings
| Date |
Closing |
Open |
Range |
Volume |
Fri 05 December 2025 |
2.71 (-3.56%) |
2.80 |
2.66 - 2.82 |
0.5214 times |
Fri 28 November 2025 |
2.81 (3.69%) |
2.72 |
2.69 - 2.87 |
0.4367 times |
Fri 21 November 2025 |
2.71 (-8.75%) |
2.96 |
2.61 - 3.05 |
0.6529 times |
Fri 14 November 2025 |
2.97 (-4.5%) |
3.13 |
2.96 - 3.13 |
0.6247 times |
Fri 07 November 2025 |
3.11 (-7.72%) |
3.27 |
2.96 - 3.49 |
1.184 times |
Fri 31 October 2025 |
3.37 (0%) |
3.43 |
3.33 - 3.55 |
0.3035 times |
Fri 31 October 2025 |
3.37 (-14.47%) |
3.95 |
3.33 - 3.99 |
1.0236 times |
Fri 24 October 2025 |
3.94 (2.07%) |
3.83 |
3.69 - 4.05 |
0.8324 times |
Fri 17 October 2025 |
3.86 (-9.6%) |
4.27 |
3.75 - 4.33 |
1.1216 times |
Fri 10 October 2025 |
4.27 (-6.15%) |
4.54 |
4.25 - 5.81 |
3.2992 times |
Fri 03 October 2025 |
4.55 (12.62%) |
4.05 |
4.01 - 5.39 |
2.7038 times |
Monthly price and charts GoodrxHoldings Strong monthly Stock price targets for GoodrxHoldings GDRX are 2.61 and 2.77 | Monthly Target 1 | 2.57 | | Monthly Target 2 | 2.64 | | Monthly Target 3 | 2.73 | | Monthly Target 4 | 2.8 | | Monthly Target 5 | 2.89 |
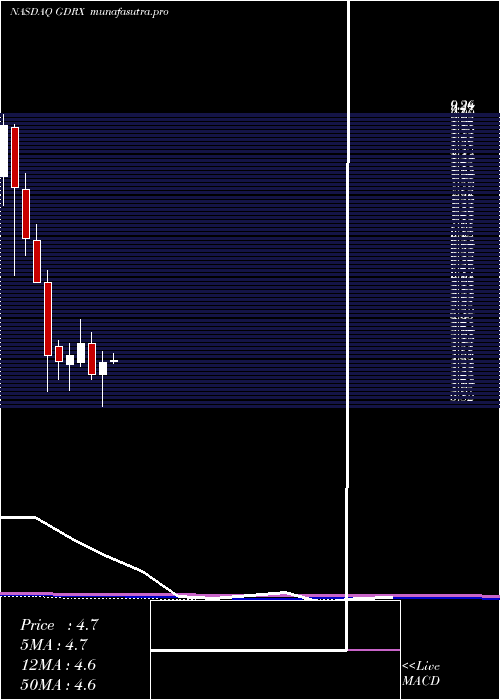
Monthly price and volumes Goodrx Holdings
| Date |
Closing |
Open |
Range |
Volume |
Fri 05 December 2025 |
2.71 (-3.56%) |
2.80 |
2.66 - 2.82 |
0.156 times |
Fri 28 November 2025 |
2.81 (-16.62%) |
3.27 |
2.61 - 3.49 |
0.867 times |
Fri 31 October 2025 |
3.37 (-20.33%) |
4.22 |
3.33 - 5.81 |
2.67 times |
Tue 30 September 2025 |
4.23 (-2.76%) |
4.25 |
3.85 - 4.35 |
0.9942 times |
Fri 29 August 2025 |
4.35 (-9.19%) |
4.71 |
3.31 - 5.41 |
2.391 times |
Thu 31 July 2025 |
4.79 (-3.82%) |
4.97 |
4.65 - 5.12 |
0.5129 times |
Mon 30 June 2025 |
4.98 (27.04%) |
3.92 |
3.78 - 5.11 |
0.6115 times |
Fri 30 May 2025 |
3.92 (-15.33%) |
4.66 |
3.68 - 4.80 |
0.7078 times |
Wed 30 April 2025 |
4.63 (4.99%) |
4.41 |
3.82 - 4.84 |
0.4028 times |
Mon 31 March 2025 |
4.41 (-11.45%) |
4.98 |
4.31 - 5.20 |
0.6867 times |
Fri 28 February 2025 |
4.98 (4.4%) |
4.63 |
4.55 - 5.43 |
0.5366 times |
DMA SMA EMA moving averages of Goodrx Holdings GDRX
DMA (daily moving average) of Goodrx Holdings GDRX
| DMA period | DMA value | | 5 day DMA | 2.72 | | 12 day DMA | 2.74 | | 20 day DMA | 2.84 | | 35 day DMA | 3.17 | | 50 day DMA | 3.52 | | 100 day DMA | 3.92 | | 150 day DMA | 4.08 | | 200 day DMA | 4.2 | EMA (exponential moving average) of Goodrx Holdings GDRX
| EMA period | EMA current | EMA prev | EMA prev2 | | 5 day EMA | 2.73 | 2.74 | 2.74 | | 12 day EMA | 2.79 | 2.81 | 2.82 | | 20 day EMA | 2.92 | 2.94 | 2.96 | | 35 day EMA | 3.18 | 3.21 | 3.24 | | 50 day EMA | 3.48 | 3.51 | 3.54 |
SMA (simple moving average) of Goodrx Holdings GDRX
| SMA period | SMA current | SMA prev | SMA prev2 | | 5 day SMA | 2.72 | 2.74 | 2.76 | | 12 day SMA | 2.74 | 2.75 | 2.75 | | 20 day SMA | 2.84 | 2.86 | 2.89 | | 35 day SMA | 3.17 | 3.2 | 3.24 | | 50 day SMA | 3.52 | 3.55 | 3.57 | | 100 day SMA | 3.92 | 3.94 | 3.96 | | 150 day SMA | 4.08 | 4.09 | 4.1 | | 200 day SMA | 4.2 | 4.21 | 4.22 |
|
|
