GcmGrosvenor GCMGW full analysis,charts,indicators,moving averages,SMA,DMA,EMA,ADX,MACD,RSIGcm Grosvenor GCMGW WideScreen charts, DMA,SMA,EMA technical analysis, forecast prediction, by indicators ADX,MACD,RSI,CCI NASDAQ stock exchange
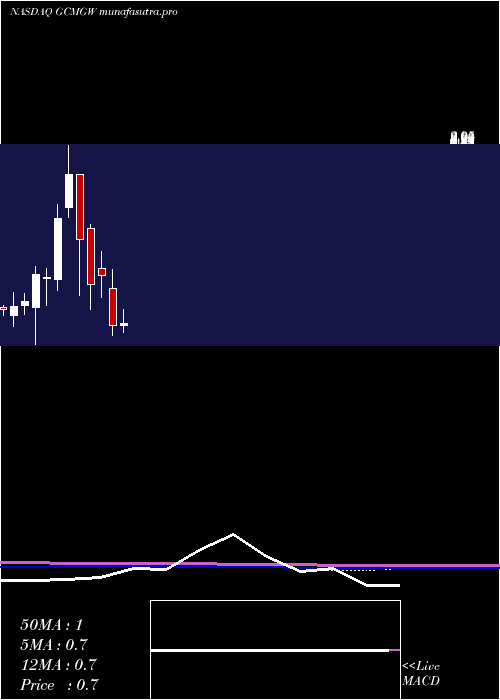
Daily price and charts and targets GcmGrosvenor Strong Daily Stock price targets for GcmGrosvenor GCMGW are 0.61 and 0.73 | Daily Target 1 | 0.51 | | Daily Target 2 | 0.59 | | Daily Target 3 | 0.63 | | Daily Target 4 | 0.71 | | Daily Target 5 | 0.75 |
Daily price and volume Gcm Grosvenor
| Date |
Closing |
Open |
Range |
Volume |
Fri 01 August 2025 |
0.67 (4.69%) |
0.60 |
0.55 - 0.67 |
0.2856 times |
Thu 31 July 2025 |
0.64 (-14.67%) |
0.60 |
0.60 - 0.76 |
0.033 times |
Wed 30 July 2025 |
0.75 (-17.58%) |
0.79 |
0.75 - 0.85 |
0.476 times |
Fri 25 July 2025 |
0.91 (1.11%) |
0.94 |
0.90 - 0.98 |
0.7396 times |
Thu 24 July 2025 |
0.90 (8.43%) |
0.82 |
0.80 - 0.90 |
0.6847 times |
Wed 23 July 2025 |
0.83 (-1.19%) |
0.85 |
0.83 - 0.85 |
0.8238 times |
Tue 22 July 2025 |
0.84 (15.07%) |
0.86 |
0.79 - 0.87 |
0.8384 times |
Mon 21 July 2025 |
0.73 (-14.12%) |
0.76 |
0.67 - 0.76 |
0.6187 times |
Thu 17 July 2025 |
0.85 (11.84%) |
0.76 |
0.76 - 0.91 |
4.0761 times |
Wed 16 July 2025 |
0.76 (4.11%) |
0.69 |
0.62 - 0.78 |
1.4242 times |
Tue 15 July 2025 |
0.73 (10.61%) |
0.66 |
0.63 - 0.79 |
3.2768 times |
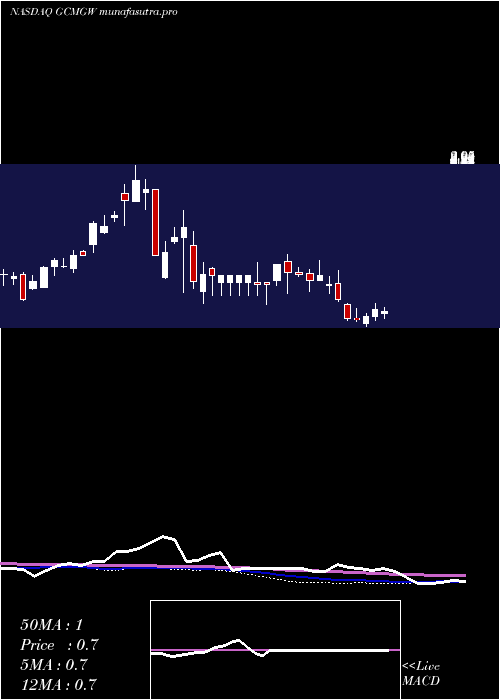
Weekly price and charts GcmGrosvenor Strong weekly Stock price targets for GcmGrosvenor GCMGW are 0.46 and 0.76 | Weekly Target 1 | 0.39 | | Weekly Target 2 | 0.53 | | Weekly Target 3 | 0.69 | | Weekly Target 4 | 0.83 | | Weekly Target 5 | 0.99 |
Weekly price and volumes for Gcm Grosvenor
| Date |
Closing |
Open |
Range |
Volume |
Fri 01 August 2025 |
0.67 (-26.37%) |
0.79 |
0.55 - 0.85 |
0.3944 times |
Fri 25 July 2025 |
0.91 (7.06%) |
0.76 |
0.67 - 0.98 |
1.8392 times |
Thu 17 July 2025 |
0.85 (10.39%) |
0.70 |
0.62 - 0.91 |
4.5096 times |
Fri 11 July 2025 |
0.77 (18.46%) |
0.66 |
0.60 - 0.85 |
0.4126 times |
Thu 03 July 2025 |
0.65 (6.56%) |
0.55 |
0.51 - 0.70 |
0.7742 times |
Fri 27 June 2025 |
0.61 (-1.61%) |
0.62 |
0.58 - 0.78 |
0.2126 times |
Fri 20 June 2025 |
0.62 (-31.87%) |
0.84 |
0.60 - 0.85 |
0.5725 times |
Fri 13 June 2025 |
0.91 (-20.18%) |
1.16 |
0.89 - 1.36 |
0.6579 times |
Fri 06 June 2025 |
1.14 (-10.94%) |
1.12 |
1.01 - 1.26 |
0.547 times |
Fri 30 May 2025 |
1.28 (5.79%) |
1.21 |
1.21 - 1.50 |
0.08 times |
Fri 23 May 2025 |
1.21 (-6.92%) |
1.31 |
1.03 - 1.37 |
4.2146 times |
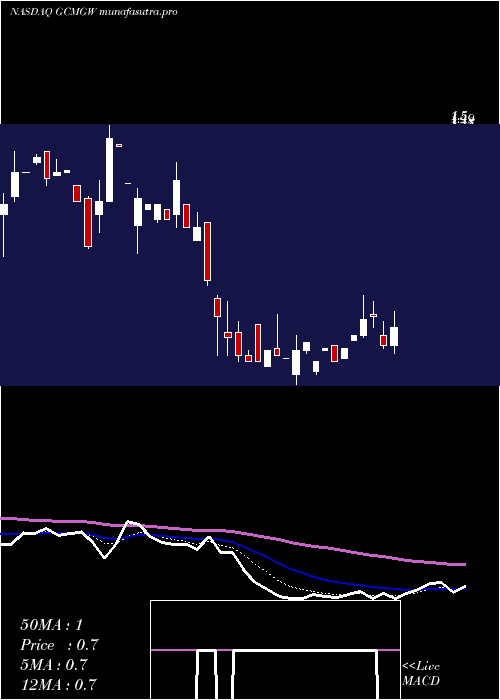
Monthly price and charts GcmGrosvenor Strong monthly Stock price targets for GcmGrosvenor GCMGW are 0.61 and 0.73 | Monthly Target 1 | 0.51 | | Monthly Target 2 | 0.59 | | Monthly Target 3 | 0.63 | | Monthly Target 4 | 0.71 | | Monthly Target 5 | 0.75 |
Monthly price and volumes Gcm Grosvenor
| Date |
Closing |
Open |
Range |
Volume |
Fri 01 August 2025 |
0.67 (4.69%) |
0.60 |
0.55 - 0.67 |
0.0096 times |
Thu 31 July 2025 |
0.64 (0%) |
0.64 |
0.55 - 0.98 |
0.486 times |
Mon 30 June 2025 |
0.64 (-50%) |
1.12 |
0.51 - 1.36 |
0.1788 times |
Fri 30 May 2025 |
1.28 (9.4%) |
1.37 |
1.00 - 1.59 |
1.0552 times |
Wed 30 April 2025 |
1.17 (-32.76%) |
1.89 |
0.84 - 1.94 |
0.9962 times |
Mon 31 March 2025 |
1.74 (-32.56%) |
2.58 |
1.02 - 2.58 |
0.2467 times |
Fri 28 February 2025 |
2.58 (27.72%) |
2.15 |
2.03 - 2.95 |
0.7354 times |
Fri 31 January 2025 |
2.02 (60.32%) |
1.23 |
1.09 - 2.19 |
1.7814 times |
Tue 31 December 2024 |
1.26 (-2.33%) |
1.24 |
0.90 - 1.37 |
0.5549 times |
Tue 26 November 2024 |
1.29 (35.79%) |
0.87 |
0.40 - 1.40 |
3.9559 times |
Thu 31 October 2024 |
0.95 (7.95%) |
0.90 |
0.78 - 1.05 |
0.2719 times |
DMA SMA EMA moving averages of Gcm Grosvenor GCMGW
DMA (daily moving average) of Gcm Grosvenor GCMGW
| DMA period | DMA value | | 5 day DMA | 0.77 | | 12 day DMA | 0.77 | | 20 day DMA | 0.73 | | 35 day DMA | 0.78 | | 50 day DMA | 0.93 | | 100 day DMA | 1.26 | | 150 day DMA | 1.41 | | 200 day DMA | 1.3 | EMA (exponential moving average) of Gcm Grosvenor GCMGW
| EMA period | EMA current | EMA prev | EMA prev2 | | 5 day EMA | 0.73 | 0.76 | 0.82 | | 12 day EMA | 0.75 | 0.77 | 0.79 | | 20 day EMA | 0.77 | 0.78 | 0.8 | | 35 day EMA | 0.88 | 0.89 | 0.9 | | 50 day EMA | 0.96 | 0.97 | 0.98 |
SMA (simple moving average) of Gcm Grosvenor GCMGW
| SMA period | SMA current | SMA prev | SMA prev2 | | 5 day SMA | 0.77 | 0.81 | 0.85 | | 12 day SMA | 0.77 | 0.78 | 0.79 | | 20 day SMA | 0.73 | 0.73 | 0.73 | | 35 day SMA | 0.78 | 0.79 | 0.81 | | 50 day SMA | 0.93 | 0.94 | 0.96 | | 100 day SMA | 1.26 | 1.28 | 1.3 | | 150 day SMA | 1.41 | 1.41 | 1.42 | | 200 day SMA | 1.3 | 1.3 | 1.3 |
|
|
