GalectinTherapeutics GALT full analysis,charts,indicators,moving averages,SMA,DMA,EMA,ADX,MACD,RSIGalectin Therapeutics GALT WideScreen charts, DMA,SMA,EMA technical analysis, forecast prediction, by indicators ADX,MACD,RSI,CCI NASDAQ stock exchange
operates under Health Care sector & deals in Major Pharmaceuticals
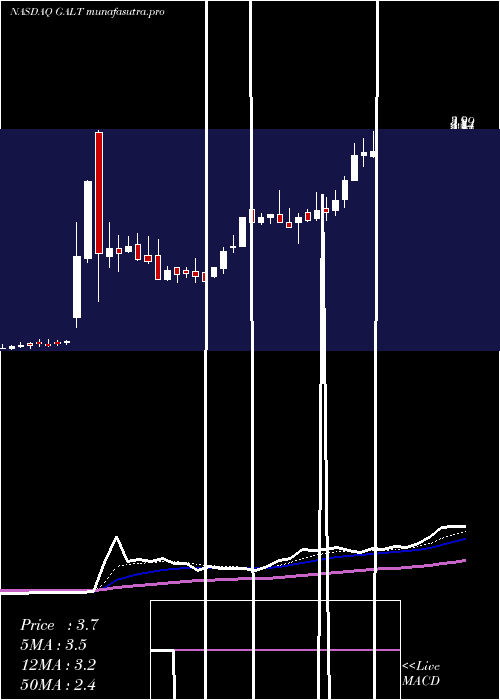
Daily price and charts and targets GalectinTherapeutics Strong Daily Stock price targets for GalectinTherapeutics GALT are 2.68 and 3.02 | Daily Target 1 | 2.4 | | Daily Target 2 | 2.62 | | Daily Target 3 | 2.7366666666667 | | Daily Target 4 | 2.96 | | Daily Target 5 | 3.08 |
Daily price and volume Galectin Therapeutics
| Date |
Closing |
Open |
Range |
Volume |
Mon 14 July 2025 |
2.85 (13.55%) |
2.51 |
2.51 - 2.85 |
1.3639 times |
Fri 11 July 2025 |
2.51 (2.45%) |
2.49 |
2.43 - 2.64 |
1.05 times |
Thu 10 July 2025 |
2.45 (8.89%) |
2.24 |
2.18 - 2.49 |
1.2364 times |
Wed 09 July 2025 |
2.25 (7.66%) |
2.15 |
2.13 - 2.25 |
0.7007 times |
Tue 08 July 2025 |
2.09 (-2.79%) |
2.19 |
2.07 - 2.19 |
0.5537 times |
Mon 07 July 2025 |
2.15 (-1.38%) |
2.21 |
2.08 - 2.36 |
1.3045 times |
Thu 03 July 2025 |
2.18 (0.46%) |
2.22 |
2.13 - 2.25 |
0.6413 times |
Wed 02 July 2025 |
2.17 (-2.25%) |
2.26 |
2.08 - 2.26 |
0.728 times |
Tue 01 July 2025 |
2.22 (5.21%) |
2.11 |
2.10 - 2.27 |
1.1973 times |
Mon 30 June 2025 |
2.11 (-9.44%) |
2.40 |
2.11 - 2.59 |
1.2241 times |
Fri 27 June 2025 |
2.33 (-0.85%) |
2.40 |
2.30 - 2.63 |
5.2142 times |
Weekly price and charts GalectinTherapeutics Strong weekly Stock price targets for GalectinTherapeutics GALT are 2.68 and 3.02 | Weekly Target 1 | 2.4 | | Weekly Target 2 | 2.62 | | Weekly Target 3 | 2.7366666666667 | | Weekly Target 4 | 2.96 | | Weekly Target 5 | 3.08 |
Weekly price and volumes for Galectin Therapeutics
| Date |
Closing |
Open |
Range |
Volume |
Mon 14 July 2025 |
2.85 (13.55%) |
2.51 |
2.51 - 2.85 |
0.1535 times |
Fri 11 July 2025 |
2.51 (15.14%) |
2.21 |
2.07 - 2.64 |
0.5453 times |
Thu 03 July 2025 |
2.18 (-6.44%) |
2.40 |
2.08 - 2.59 |
0.4266 times |
Fri 27 June 2025 |
2.33 (-3.72%) |
2.39 |
2.21 - 2.80 |
1.2847 times |
Fri 20 June 2025 |
2.42 (76.64%) |
1.65 |
1.54 - 3.90 |
6.4238 times |
Fri 13 June 2025 |
1.37 (3.79%) |
1.34 |
1.28 - 1.39 |
0.2186 times |
Fri 06 June 2025 |
1.32 (0.76%) |
1.29 |
1.27 - 1.37 |
0.253 times |
Fri 30 May 2025 |
1.31 (2.34%) |
1.36 |
1.22 - 1.36 |
0.2082 times |
Fri 23 May 2025 |
1.28 (0%) |
1.29 |
1.24 - 1.35 |
0.2353 times |
Fri 16 May 2025 |
1.28 (-7.25%) |
1.47 |
1.21 - 1.55 |
0.2509 times |
Fri 09 May 2025 |
1.38 (-0.72%) |
1.36 |
1.26 - 1.63 |
0.3369 times |

Monthly price and charts GalectinTherapeutics Strong monthly Stock price targets for GalectinTherapeutics GALT are 2.46 and 3.24 | Monthly Target 1 | 1.81 | | Monthly Target 2 | 2.33 | | Monthly Target 3 | 2.59 | | Monthly Target 4 | 3.11 | | Monthly Target 5 | 3.37 |
Monthly price and volumes Galectin Therapeutics
| Date |
Closing |
Open |
Range |
Volume |
Mon 14 July 2025 |
2.85 (35.07%) |
2.11 |
2.07 - 2.85 |
0.3507 times |
Mon 30 June 2025 |
2.11 (61.07%) |
1.29 |
1.27 - 3.90 |
2.9531 times |
Fri 30 May 2025 |
1.31 (-4.38%) |
1.40 |
1.21 - 1.63 |
0.3857 times |
Wed 30 April 2025 |
1.37 (12.3%) |
1.22 |
1.12 - 1.48 |
0.415 times |
Mon 31 March 2025 |
1.22 (-22.29%) |
1.59 |
1.19 - 1.82 |
0.5709 times |
Fri 28 February 2025 |
1.57 (25.6%) |
1.23 |
1.19 - 1.63 |
0.5576 times |
Fri 31 January 2025 |
1.25 (-3.1%) |
1.31 |
1.07 - 1.39 |
0.8198 times |
Tue 31 December 2024 |
1.29 (-53.43%) |
2.03 |
0.73 - 2.36 |
3.2803 times |
Tue 26 November 2024 |
2.77 (12.15%) |
2.51 |
2.45 - 3.17 |
0.3395 times |
Thu 31 October 2024 |
2.47 (-10.18%) |
2.76 |
2.45 - 3.16 |
0.3274 times |
Mon 30 September 2024 |
2.75 (1.85%) |
2.64 |
2.40 - 2.98 |
0.2556 times |

DMA SMA EMA moving averages of Galectin Therapeutics GALT
DMA (daily moving average) of Galectin Therapeutics GALT
| DMA period | DMA value | | 5 day DMA | 2.43 | | 12 day DMA | 2.31 | | 20 day DMA | 2.29 | | 35 day DMA | 1.87 | | 50 day DMA | 1.71 | | 100 day DMA | 1.59 | | 150 day DMA | 1.54 | | 200 day DMA | 1.83 | EMA (exponential moving average) of Galectin Therapeutics GALT
| EMA period | EMA current | EMA prev | EMA prev2 | | 5 day EMA | 2.52 | 2.36 | 2.28 | | 12 day EMA | 2.35 | 2.26 | 2.21 | | 20 day EMA | 2.22 | 2.15 | 2.11 | | 35 day EMA | 2.01 | 1.96 | 1.93 | | 50 day EMA | 1.75 | 1.7 | 1.67 |
SMA (simple moving average) of Galectin Therapeutics GALT
| SMA period | SMA current | SMA prev | SMA prev2 | | 5 day SMA | 2.43 | 2.29 | 2.22 | | 12 day SMA | 2.31 | 2.28 | 2.27 | | 20 day SMA | 2.29 | 2.22 | 2.16 | | 35 day SMA | 1.87 | 1.82 | 1.79 | | 50 day SMA | 1.71 | 1.68 | 1.66 | | 100 day SMA | 1.59 | 1.57 | 1.56 | | 150 day SMA | 1.54 | 1.54 | 1.54 | | 200 day SMA | 1.83 | 1.83 | 1.83 |
|
|
