FarmersNational FMNB full analysis,charts,indicators,moving averages,SMA,DMA,EMA,ADX,MACD,RSIFarmers National FMNB WideScreen charts, DMA,SMA,EMA technical analysis, forecast prediction, by indicators ADX,MACD,RSI,CCI NASDAQ stock exchange
operates under Finance sector & deals in Major Banks
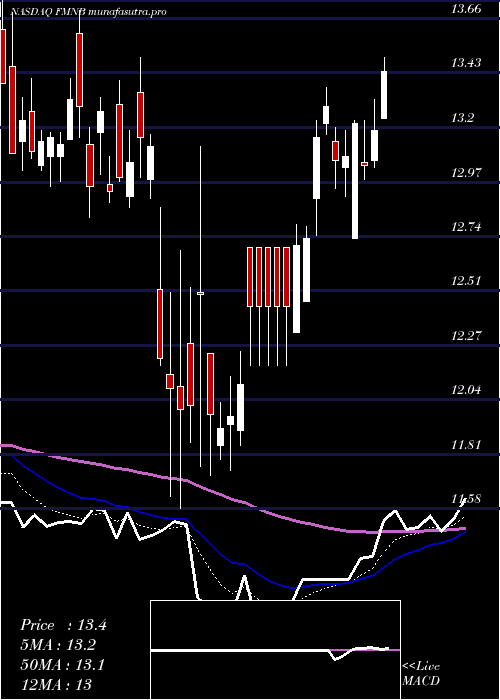
Daily price and charts and targets FarmersNational Strong Daily Stock price targets for FarmersNational FMNB are 13.7 and 13.93 | Daily Target 1 | 13.66 | | Daily Target 2 | 13.74 | | Daily Target 3 | 13.886666666667 | | Daily Target 4 | 13.97 | | Daily Target 5 | 14.12 |
Daily price and volume Farmers National
| Date |
Closing |
Open |
Range |
Volume |
Fri 05 December 2025 |
13.83 (-1.71%) |
14.03 |
13.80 - 14.03 |
0.5553 times |
Thu 04 December 2025 |
14.07 (0.72%) |
13.89 |
13.88 - 14.08 |
0.6148 times |
Wed 03 December 2025 |
13.97 (3.1%) |
13.60 |
13.57 - 13.98 |
0.92 times |
Tue 02 December 2025 |
13.55 (-0.51%) |
13.67 |
13.51 - 13.68 |
0.6809 times |
Mon 01 December 2025 |
13.62 (0.22%) |
13.52 |
13.52 - 13.73 |
0.9947 times |
Fri 28 November 2025 |
13.59 (-0.07%) |
13.59 |
13.49 - 13.64 |
0.5711 times |
Wed 26 November 2025 |
13.60 (0.22%) |
13.51 |
13.45 - 13.63 |
1.1755 times |
Tue 25 November 2025 |
13.57 (2.03%) |
13.36 |
13.21 - 13.69 |
1.5348 times |
Mon 24 November 2025 |
13.30 (0.08%) |
13.28 |
13.16 - 13.53 |
1.6288 times |
Fri 21 November 2025 |
13.29 (3.02%) |
12.84 |
12.84 - 13.44 |
1.3242 times |
Thu 20 November 2025 |
12.90 (0.31%) |
12.99 |
12.85 - 13.23 |
1.0371 times |
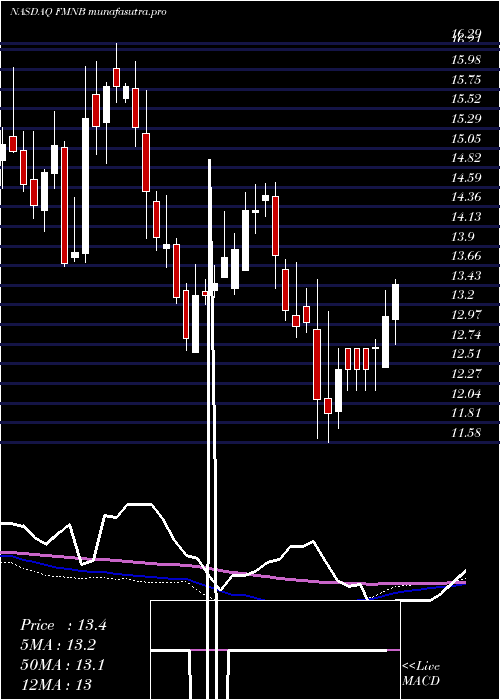
Weekly price and charts FarmersNational Strong weekly Stock price targets for FarmersNational FMNB are 13.67 and 14.24 | Weekly Target 1 | 13.24 | | Weekly Target 2 | 13.53 | | Weekly Target 3 | 13.806666666667 | | Weekly Target 4 | 14.1 | | Weekly Target 5 | 14.38 |
Weekly price and volumes for Farmers National
| Date |
Closing |
Open |
Range |
Volume |
Fri 05 December 2025 |
13.83 (1.77%) |
13.52 |
13.51 - 14.08 |
0.816 times |
Fri 28 November 2025 |
13.59 (2.26%) |
13.28 |
13.16 - 13.69 |
1.064 times |
Fri 21 November 2025 |
13.29 (0%) |
13.30 |
12.81 - 13.44 |
1.0702 times |
Fri 14 November 2025 |
13.29 (1.14%) |
13.23 |
13.02 - 13.51 |
1.063 times |
Fri 07 November 2025 |
13.14 (1.23%) |
12.94 |
12.90 - 13.39 |
1.0952 times |
Fri 31 October 2025 |
12.98 (0%) |
12.98 |
12.87 - 13.11 |
0.3088 times |
Fri 31 October 2025 |
12.98 (-4.56%) |
13.60 |
12.81 - 13.75 |
1.7882 times |
Fri 24 October 2025 |
13.60 (-1.09%) |
13.87 |
13.13 - 14.04 |
1.6758 times |
Fri 17 October 2025 |
13.75 (0.15%) |
13.90 |
13.47 - 14.40 |
0.5719 times |
Fri 10 October 2025 |
13.73 (-3.78%) |
14.35 |
13.71 - 14.50 |
0.5469 times |
Fri 03 October 2025 |
14.27 (-1.86%) |
14.57 |
14.07 - 14.59 |
0.5668 times |
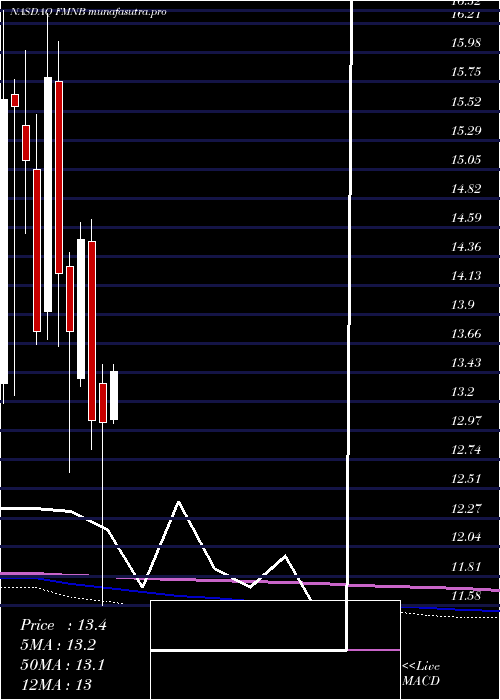
Monthly price and charts FarmersNational Strong monthly Stock price targets for FarmersNational FMNB are 13.67 and 14.24 | Monthly Target 1 | 13.24 | | Monthly Target 2 | 13.53 | | Monthly Target 3 | 13.806666666667 | | Monthly Target 4 | 14.1 | | Monthly Target 5 | 14.38 |
Monthly price and volumes Farmers National
| Date |
Closing |
Open |
Range |
Volume |
Fri 05 December 2025 |
13.83 (1.77%) |
13.52 |
13.51 - 14.08 |
0.285 times |
Fri 28 November 2025 |
13.59 (4.7%) |
12.94 |
12.81 - 13.69 |
1.4991 times |
Fri 31 October 2025 |
12.98 (-9.92%) |
14.25 |
12.81 - 14.51 |
1.8166 times |
Tue 30 September 2025 |
14.41 (-5.07%) |
15.00 |
14.21 - 15.50 |
0.8812 times |
Fri 29 August 2025 |
15.18 (12.11%) |
13.31 |
13.11 - 15.31 |
0.9977 times |
Thu 31 July 2025 |
13.54 (-1.81%) |
13.70 |
13.21 - 14.77 |
1.0302 times |
Mon 30 June 2025 |
13.79 (4.23%) |
13.26 |
12.62 - 13.95 |
0.9705 times |
Fri 30 May 2025 |
13.23 (1.46%) |
13.06 |
12.87 - 14.03 |
0.5839 times |
Wed 30 April 2025 |
13.04 (-0.08%) |
13.35 |
11.58 - 13.50 |
1.024 times |
Mon 31 March 2025 |
13.05 (-9.94%) |
14.48 |
12.82 - 14.65 |
0.9117 times |
Fri 28 February 2025 |
14.49 (5.31%) |
13.39 |
13.32 - 14.63 |
0.6829 times |
DMA SMA EMA moving averages of Farmers National FMNB
DMA (daily moving average) of Farmers National FMNB
| DMA period | DMA value | | 5 day DMA | 13.81 | | 12 day DMA | 13.51 | | 20 day DMA | 13.38 | | 35 day DMA | 13.37 | | 50 day DMA | 13.61 | | 100 day DMA | 13.99 | | 150 day DMA | 13.85 | | 200 day DMA | 13.66 | EMA (exponential moving average) of Farmers National FMNB
| EMA period | EMA current | EMA prev | EMA prev2 | | 5 day EMA | 13.81 | 13.8 | 13.67 | | 12 day EMA | 13.62 | 13.58 | 13.49 | | 20 day EMA | 13.54 | 13.51 | 13.45 | | 35 day EMA | 13.59 | 13.58 | 13.55 | | 50 day EMA | 13.71 | 13.7 | 13.69 |
SMA (simple moving average) of Farmers National FMNB
| SMA period | SMA current | SMA prev | SMA prev2 | | 5 day SMA | 13.81 | 13.76 | 13.67 | | 12 day SMA | 13.51 | 13.43 | 13.34 | | 20 day SMA | 13.38 | 13.36 | 13.32 | | 35 day SMA | 13.37 | 13.37 | 13.37 | | 50 day SMA | 13.61 | 13.62 | 13.63 | | 100 day SMA | 13.99 | 13.99 | 13.99 | | 150 day SMA | 13.85 | 13.84 | 13.83 | | 200 day SMA | 13.66 | 13.66 | 13.66 |
|
|
