FinancialInstitutions FISI full analysis,charts,indicators,moving averages,SMA,DMA,EMA,ADX,MACD,RSIFinancial Institutions FISI WideScreen charts, DMA,SMA,EMA technical analysis, forecast prediction, by indicators ADX,MACD,RSI,CCI NASDAQ stock exchange
operates under Finance sector & deals in Major Banks
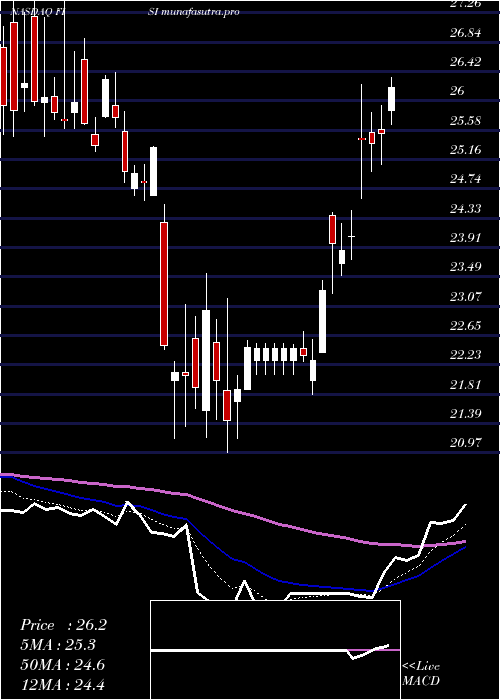
Daily price and charts and targets FinancialInstitutions Strong Daily Stock price targets for FinancialInstitutions FISI are 30.64 and 31.05 | Daily Target 1 | 30.57 | | Daily Target 2 | 30.71 | | Daily Target 3 | 30.976666666667 | | Daily Target 4 | 31.12 | | Daily Target 5 | 31.39 |
Daily price and volume Financial Institutions
| Date |
Closing |
Open |
Range |
Volume |
Fri 05 December 2025 |
30.86 (-1.22%) |
31.12 |
30.83 - 31.24 |
0.5801 times |
Thu 04 December 2025 |
31.24 (-0.06%) |
31.18 |
31.00 - 31.42 |
0.7534 times |
Wed 03 December 2025 |
31.26 (2.32%) |
30.79 |
30.62 - 31.29 |
0.9752 times |
Tue 02 December 2025 |
30.55 (-0.29%) |
30.84 |
30.45 - 30.84 |
0.538 times |
Mon 01 December 2025 |
30.64 (0.13%) |
30.36 |
30.28 - 30.96 |
1.5956 times |
Fri 28 November 2025 |
30.60 (0.03%) |
30.53 |
30.28 - 30.69 |
0.5233 times |
Wed 26 November 2025 |
30.59 (-0.55%) |
30.66 |
30.44 - 30.78 |
0.6361 times |
Tue 25 November 2025 |
30.76 (3.74%) |
29.90 |
29.82 - 30.91 |
1.9998 times |
Mon 24 November 2025 |
29.65 (0.61%) |
29.50 |
29.34 - 29.76 |
1.2794 times |
Fri 21 November 2025 |
29.47 (3.4%) |
28.57 |
28.50 - 29.67 |
1.1191 times |
Thu 20 November 2025 |
28.50 (-0.31%) |
28.92 |
28.47 - 29.27 |
0.8899 times |
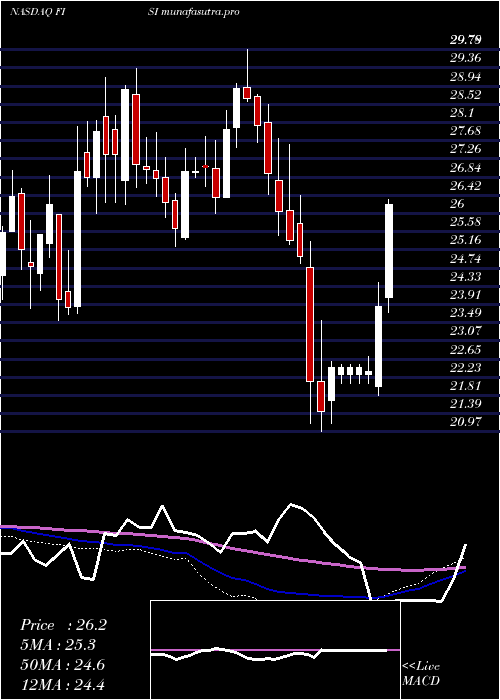
Weekly price and charts FinancialInstitutions Strong weekly Stock price targets for FinancialInstitutions FISI are 30.57 and 31.71 | Weekly Target 1 | 29.71 | | Weekly Target 2 | 30.29 | | Weekly Target 3 | 30.853333333333 | | Weekly Target 4 | 31.43 | | Weekly Target 5 | 31.99 |
Weekly price and volumes for Financial Institutions
| Date |
Closing |
Open |
Range |
Volume |
Fri 05 December 2025 |
30.86 (0.85%) |
30.36 |
30.28 - 31.42 |
0.8842 times |
Fri 28 November 2025 |
30.60 (3.83%) |
29.50 |
29.34 - 30.91 |
0.8835 times |
Fri 21 November 2025 |
29.47 (0.75%) |
29.10 |
28.21 - 29.67 |
0.9831 times |
Fri 14 November 2025 |
29.25 (-0.27%) |
29.44 |
28.77 - 30.07 |
0.8065 times |
Fri 07 November 2025 |
29.33 (3.17%) |
28.80 |
28.46 - 29.34 |
0.8936 times |
Fri 31 October 2025 |
28.43 (0%) |
28.35 |
28.00 - 28.59 |
0.2224 times |
Fri 31 October 2025 |
28.43 (-1.8%) |
29.39 |
28.00 - 29.88 |
1.6964 times |
Fri 24 October 2025 |
28.95 (12.56%) |
25.83 |
25.83 - 29.25 |
1.223 times |
Fri 17 October 2025 |
25.72 (-2.02%) |
26.73 |
25.61 - 27.77 |
1.1811 times |
Fri 10 October 2025 |
26.25 (-3.1%) |
27.38 |
26.25 - 27.99 |
1.2261 times |
Fri 03 October 2025 |
27.09 (-1.31%) |
27.52 |
26.72 - 27.52 |
1.4392 times |
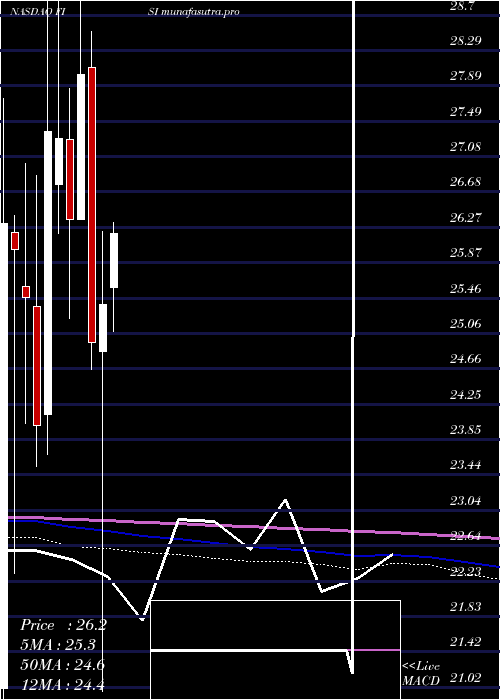
Monthly price and charts FinancialInstitutions Strong monthly Stock price targets for FinancialInstitutions FISI are 30.57 and 31.71 | Monthly Target 1 | 29.71 | | Monthly Target 2 | 30.29 | | Monthly Target 3 | 30.853333333333 | | Monthly Target 4 | 31.43 | | Monthly Target 5 | 31.99 |
Monthly price and volumes Financial Institutions
| Date |
Closing |
Open |
Range |
Volume |
Fri 05 December 2025 |
30.86 (0.85%) |
30.36 |
30.28 - 31.42 |
0.1719 times |
Fri 28 November 2025 |
30.60 (7.63%) |
28.80 |
28.21 - 30.91 |
0.6933 times |
Fri 31 October 2025 |
28.43 (4.52%) |
27.01 |
25.61 - 29.88 |
1.1961 times |
Tue 30 September 2025 |
27.20 (-1.7%) |
27.33 |
26.07 - 28.13 |
0.9084 times |
Fri 29 August 2025 |
27.67 (8.55%) |
25.22 |
24.62 - 27.85 |
1.0013 times |
Thu 31 July 2025 |
25.49 (-0.74%) |
25.60 |
25.25 - 27.72 |
1.1687 times |
Mon 30 June 2025 |
25.68 (-0.54%) |
25.84 |
24.41 - 26.60 |
1.0875 times |
Fri 30 May 2025 |
25.82 (1.69%) |
25.59 |
25.08 - 27.99 |
0.7033 times |
Wed 30 April 2025 |
25.39 (1.72%) |
24.85 |
20.97 - 26.23 |
1.479 times |
Mon 31 March 2025 |
24.96 (-10.92%) |
28.10 |
24.65 - 28.51 |
1.5906 times |
Fri 28 February 2025 |
28.02 (6.26%) |
26.37 |
26.37 - 29.79 |
1.008 times |
DMA SMA EMA moving averages of Financial Institutions FISI
DMA (daily moving average) of Financial Institutions FISI
| DMA period | DMA value | | 5 day DMA | 30.91 | | 12 day DMA | 30.23 | | 20 day DMA | 29.83 | | 35 day DMA | 29.09 | | 50 day DMA | 28.46 | | 100 day DMA | 27.53 | | 150 day DMA | 27.08 | | 200 day DMA | 26.52 | EMA (exponential moving average) of Financial Institutions FISI
| EMA period | EMA current | EMA prev | EMA prev2 | | 5 day EMA | 30.87 | 30.88 | 30.7 | | 12 day EMA | 30.39 | 30.3 | 30.13 | | 20 day EMA | 29.94 | 29.84 | 29.69 | | 35 day EMA | 29.23 | 29.13 | 29.01 | | 50 day EMA | 28.58 | 28.49 | 28.38 |
SMA (simple moving average) of Financial Institutions FISI
| SMA period | SMA current | SMA prev | SMA prev2 | | 5 day SMA | 30.91 | 30.86 | 30.73 | | 12 day SMA | 30.23 | 30.01 | 29.79 | | 20 day SMA | 29.83 | 29.75 | 29.65 | | 35 day SMA | 29.09 | 28.94 | 28.82 | | 50 day SMA | 28.46 | 28.39 | 28.31 | | 100 day SMA | 27.53 | 27.49 | 27.45 | | 150 day SMA | 27.08 | 27.04 | 27 | | 200 day SMA | 26.52 | 26.52 | 26.51 |
|
|
