FidusInvestment FDUS full analysis,charts,indicators,moving averages,SMA,DMA,EMA,ADX,MACD,RSIFidus Investment FDUS WideScreen charts, DMA,SMA,EMA technical analysis, forecast prediction, by indicators ADX,MACD,RSI,CCI NASDAQ stock exchange
operates under N A sector & deals in N A
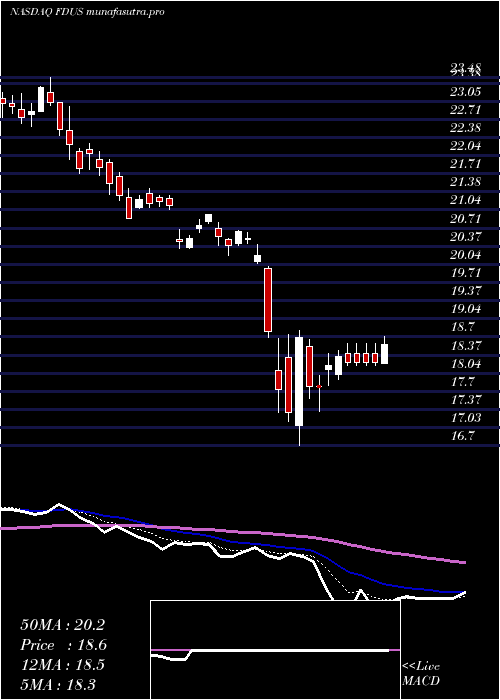
Daily price and charts and targets FidusInvestment Strong Daily Stock price targets for FidusInvestment FDUS are 19.62 and 19.89 | Daily Target 1 | 19.52 | | Daily Target 2 | 19.64 | | Daily Target 3 | 19.793333333333 | | Daily Target 4 | 19.91 | | Daily Target 5 | 20.06 |
Daily price and volume Fidus Investment
| Date |
Closing |
Open |
Range |
Volume |
Fri 05 December 2025 |
19.75 (0%) |
19.75 |
19.68 - 19.95 |
2.1678 times |
Thu 04 December 2025 |
19.75 (0%) |
19.74 |
19.70 - 19.89 |
1.4382 times |
Wed 03 December 2025 |
19.75 (0.3%) |
19.67 |
19.58 - 19.86 |
1.6047 times |
Tue 02 December 2025 |
19.69 (0.2%) |
19.65 |
19.56 - 19.75 |
0.8172 times |
Mon 01 December 2025 |
19.65 (-0.3%) |
19.71 |
19.59 - 19.75 |
0.7219 times |
Fri 28 November 2025 |
19.71 (0.05%) |
19.73 |
19.60 - 19.77 |
0.5084 times |
Wed 26 November 2025 |
19.70 (0.15%) |
19.66 |
19.58 - 19.78 |
0.731 times |
Tue 25 November 2025 |
19.67 (0.87%) |
19.49 |
19.45 - 19.73 |
0.613 times |
Mon 24 November 2025 |
19.50 (0.36%) |
19.41 |
19.25 - 19.60 |
0.6556 times |
Fri 21 November 2025 |
19.43 (2.16%) |
19.16 |
19.05 - 19.56 |
0.7421 times |
Thu 20 November 2025 |
19.02 (-0.99%) |
19.26 |
19.02 - 19.50 |
0.6654 times |
Weekly price and charts FidusInvestment Strong weekly Stock price targets for FidusInvestment FDUS are 19.66 and 20.05 | Weekly Target 1 | 19.36 | | Weekly Target 2 | 19.56 | | Weekly Target 3 | 19.753333333333 | | Weekly Target 4 | 19.95 | | Weekly Target 5 | 20.14 |
Weekly price and volumes for Fidus Investment
| Date |
Closing |
Open |
Range |
Volume |
Fri 05 December 2025 |
19.75 (0.2%) |
19.71 |
19.56 - 19.95 |
1.8238 times |
Fri 28 November 2025 |
19.71 (1.44%) |
19.41 |
19.25 - 19.78 |
0.6777 times |
Fri 21 November 2025 |
19.43 (-1.62%) |
19.57 |
19.02 - 19.68 |
1.0156 times |
Fri 14 November 2025 |
19.75 (-0.1%) |
19.88 |
19.50 - 20.03 |
1.5241 times |
Fri 07 November 2025 |
19.77 (-3.75%) |
20.70 |
19.37 - 20.95 |
0.7958 times |
Fri 31 October 2025 |
20.54 (0%) |
20.53 |
20.38 - 20.75 |
0.1187 times |
Fri 31 October 2025 |
20.54 (-0.34%) |
20.65 |
20.25 - 21.15 |
0.8038 times |
Fri 24 October 2025 |
20.61 (3.31%) |
19.91 |
19.78 - 20.86 |
0.7327 times |
Fri 17 October 2025 |
19.95 (3.31%) |
19.40 |
19.40 - 20.47 |
0.971 times |
Fri 10 October 2025 |
19.31 (-5.62%) |
20.54 |
19.30 - 20.63 |
1.5367 times |
Fri 03 October 2025 |
20.46 (1.39%) |
20.29 |
20.05 - 20.63 |
0.934 times |

Monthly price and charts FidusInvestment Strong monthly Stock price targets for FidusInvestment FDUS are 19.66 and 20.05 | Monthly Target 1 | 19.36 | | Monthly Target 2 | 19.56 | | Monthly Target 3 | 19.753333333333 | | Monthly Target 4 | 19.95 | | Monthly Target 5 | 20.14 |
Monthly price and volumes Fidus Investment
| Date |
Closing |
Open |
Range |
Volume |
Fri 05 December 2025 |
19.75 (0.2%) |
19.71 |
19.56 - 19.95 |
0.4638 times |
Fri 28 November 2025 |
19.71 (-4.04%) |
20.70 |
19.02 - 20.95 |
1.0205 times |
Fri 31 October 2025 |
20.54 (1.38%) |
20.21 |
19.30 - 21.15 |
1.19 times |
Tue 30 September 2025 |
20.26 (-5.9%) |
21.49 |
20.07 - 21.67 |
1.3073 times |
Fri 29 August 2025 |
21.53 (4.11%) |
20.50 |
20.30 - 21.60 |
0.884 times |
Thu 31 July 2025 |
20.68 (2.38%) |
20.20 |
20.11 - 22.09 |
0.6947 times |
Mon 30 June 2025 |
20.20 (-1.42%) |
20.50 |
19.40 - 20.68 |
0.9745 times |
Fri 30 May 2025 |
20.49 (8.41%) |
18.90 |
18.62 - 20.77 |
0.8302 times |
Wed 30 April 2025 |
18.90 (-7.31%) |
20.43 |
16.70 - 20.66 |
1.2052 times |
Mon 31 March 2025 |
20.39 (-12.45%) |
23.21 |
20.20 - 23.48 |
1.4298 times |
Fri 28 February 2025 |
23.29 (3.01%) |
22.32 |
22.28 - 23.55 |
0.6676 times |

DMA SMA EMA moving averages of Fidus Investment FDUS
DMA (daily moving average) of Fidus Investment FDUS
| DMA period | DMA value | | 5 day DMA | 19.72 | | 12 day DMA | 19.57 | | 20 day DMA | 19.59 | | 35 day DMA | 20.02 | | 50 day DMA | 20.03 | | 100 day DMA | 20.61 | | 150 day DMA | 20.47 | | 200 day DMA | 20.43 | EMA (exponential moving average) of Fidus Investment FDUS
| EMA period | EMA current | EMA prev | EMA prev2 | | 5 day EMA | 19.72 | 19.7 | 19.68 | | 12 day EMA | 19.68 | 19.67 | 19.66 | | 20 day EMA | 19.74 | 19.74 | 19.74 | | 35 day EMA | 19.84 | 19.85 | 19.86 | | 50 day EMA | 20.04 | 20.05 | 20.06 |
SMA (simple moving average) of Fidus Investment FDUS
| SMA period | SMA current | SMA prev | SMA prev2 | | 5 day SMA | 19.72 | 19.71 | 19.7 | | 12 day SMA | 19.57 | 19.53 | 19.49 | | 20 day SMA | 19.59 | 19.64 | 19.69 | | 35 day SMA | 20.02 | 20.02 | 20.03 | | 50 day SMA | 20.03 | 20.05 | 20.06 | | 100 day SMA | 20.61 | 20.63 | 20.64 | | 150 day SMA | 20.47 | 20.46 | 20.45 | | 200 day SMA | 20.43 | 20.44 | 20.46 |
|
|
