FirstcashInc FCFS full analysis,charts,indicators,moving averages,SMA,DMA,EMA,ADX,MACD,RSIFirstcash Inc FCFS WideScreen charts, DMA,SMA,EMA technical analysis, forecast prediction, by indicators ADX,MACD,RSI,CCI NASDAQ stock exchange
operates under Consumer Services sector & deals in Other Specialty Stores
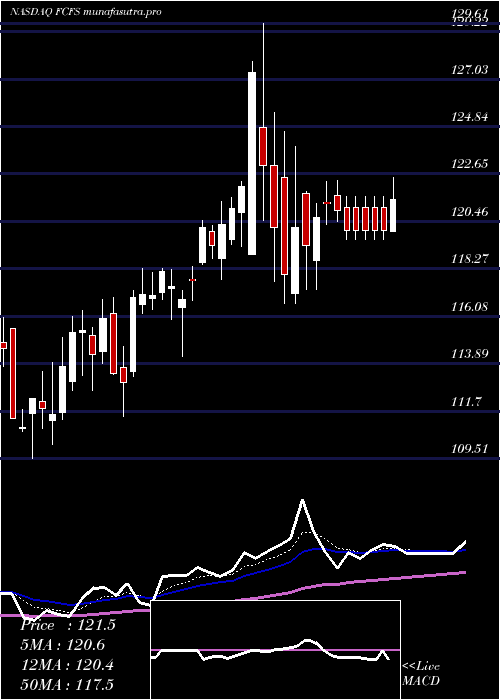
Daily price and charts and targets FirstcashInc Strong Daily Stock price targets for FirstcashInc FCFS are 130.04 and 133.01 | Daily Target 1 | 129.32 | | Daily Target 2 | 130.75 | | Daily Target 3 | 132.29333333333 | | Daily Target 4 | 133.72 | | Daily Target 5 | 135.26 |
Daily price and volume Firstcash Inc
| Date |
Closing |
Open |
Range |
Volume |
Fri 11 July 2025 |
132.17 (-0.43%) |
132.59 |
130.87 - 133.84 |
0.7651 times |
Thu 10 July 2025 |
132.74 (-0.71%) |
133.60 |
132.57 - 135.61 |
0.8252 times |
Wed 09 July 2025 |
133.69 (-0.17%) |
134.55 |
132.18 - 134.55 |
0.8118 times |
Tue 08 July 2025 |
133.92 (-1.46%) |
136.08 |
133.37 - 137.80 |
1.117 times |
Mon 07 July 2025 |
135.90 (-0.64%) |
136.70 |
135.22 - 137.75 |
0.7943 times |
Thu 03 July 2025 |
136.77 (0.01%) |
137.74 |
136.10 - 137.92 |
0.44 times |
Wed 02 July 2025 |
136.76 (0.93%) |
135.50 |
134.90 - 137.16 |
0.8948 times |
Tue 01 July 2025 |
135.50 (0.27%) |
134.72 |
134.62 - 136.38 |
0.8481 times |
Mon 30 June 2025 |
135.14 (0.46%) |
134.72 |
133.44 - 135.73 |
1.0745 times |
Fri 27 June 2025 |
134.52 (-2.26%) |
137.18 |
131.86 - 137.18 |
2.4292 times |
Thu 26 June 2025 |
137.63 (2.32%) |
134.04 |
131.27 - 138.42 |
1.6476 times |
Weekly price and charts FirstcashInc Strong weekly Stock price targets for FirstcashInc FCFS are 128.06 and 134.99 | Weekly Target 1 | 126.68 | | Weekly Target 2 | 129.43 | | Weekly Target 3 | 133.61333333333 | | Weekly Target 4 | 136.36 | | Weekly Target 5 | 140.54 |
Weekly price and volumes for Firstcash Inc
| Date |
Closing |
Open |
Range |
Volume |
Fri 11 July 2025 |
132.17 (-3.36%) |
136.70 |
130.87 - 137.80 |
0.9467 times |
Thu 03 July 2025 |
136.77 (1.67%) |
134.72 |
133.44 - 137.92 |
0.7149 times |
Fri 27 June 2025 |
134.52 (3.83%) |
129.95 |
128.90 - 138.42 |
1.5737 times |
Fri 20 June 2025 |
129.56 (-0.45%) |
129.58 |
128.07 - 130.30 |
0.6866 times |
Fri 13 June 2025 |
130.14 (3.47%) |
125.78 |
125.50 - 133.85 |
1.0885 times |
Fri 06 June 2025 |
125.78 (-1.67%) |
127.75 |
122.77 - 128.33 |
0.8509 times |
Fri 30 May 2025 |
127.91 (0.32%) |
127.91 |
126.22 - 128.99 |
0.662 times |
Fri 23 May 2025 |
127.50 (0.64%) |
126.54 |
124.38 - 128.92 |
1.0302 times |
Fri 16 May 2025 |
126.69 (-4.56%) |
134.21 |
125.10 - 134.21 |
1.3302 times |
Fri 09 May 2025 |
132.75 (-0.87%) |
133.78 |
132.38 - 135.57 |
1.1164 times |
Fri 02 May 2025 |
133.91 (1.49%) |
132.21 |
131.79 - 134.85 |
1.6583 times |

Monthly price and charts FirstcashInc Strong monthly Stock price targets for FirstcashInc FCFS are 128 and 135.05 | Monthly Target 1 | 126.6 | | Monthly Target 2 | 129.39 | | Monthly Target 3 | 133.65333333333 | | Monthly Target 4 | 136.44 | | Monthly Target 5 | 140.7 |
Monthly price and volumes Firstcash Inc
| Date |
Closing |
Open |
Range |
Volume |
Fri 11 July 2025 |
132.17 (-2.2%) |
134.72 |
130.87 - 137.92 |
0.3563 times |
Mon 30 June 2025 |
135.14 (5.65%) |
127.75 |
122.77 - 138.42 |
1.1083 times |
Fri 30 May 2025 |
127.91 (-4.52%) |
134.01 |
124.38 - 135.57 |
1.1397 times |
Wed 30 April 2025 |
133.96 (11.34%) |
119.61 |
116.66 - 134.85 |
1.6904 times |
Mon 31 March 2025 |
120.32 (7.16%) |
112.17 |
110.16 - 121.36 |
1.0302 times |
Fri 28 February 2025 |
112.28 (2.87%) |
107.37 |
106.77 - 118.87 |
0.8789 times |
Fri 31 January 2025 |
109.15 (5.36%) |
103.94 |
102.42 - 115.19 |
0.9534 times |
Tue 31 December 2024 |
103.60 (-3.27%) |
105.23 |
100.24 - 110.25 |
0.716 times |
Tue 26 November 2024 |
107.10 (3.51%) |
104.14 |
102.84 - 116.71 |
0.934 times |
Thu 31 October 2024 |
103.47 (-9.87%) |
115.06 |
101.62 - 116.03 |
1.1927 times |
Mon 30 September 2024 |
114.80 (-4.41%) |
119.29 |
111.95 - 120.99 |
0.78 times |

DMA SMA EMA moving averages of Firstcash Inc FCFS
DMA (daily moving average) of Firstcash Inc FCFS
| DMA period | DMA value | | 5 day DMA | 133.68 | | 12 day DMA | 134.94 | | 20 day DMA | 132.98 | | 35 day DMA | 130.53 | | 50 day DMA | 130.91 | | 100 day DMA | 124.71 | | 150 day DMA | 119.42 | | 200 day DMA | 117.22 | EMA (exponential moving average) of Firstcash Inc FCFS
| EMA period | EMA current | EMA prev | EMA prev2 | | 5 day EMA | 133.42 | 134.05 | 134.7 | | 12 day EMA | 133.64 | 133.91 | 134.12 | | 20 day EMA | 132.96 | 133.04 | 133.07 | | 35 day EMA | 132.12 | 132.12 | 132.08 | | 50 day EMA | 130.91 | 130.86 | 130.78 |
SMA (simple moving average) of Firstcash Inc FCFS
| SMA period | SMA current | SMA prev | SMA prev2 | | 5 day SMA | 133.68 | 134.6 | 135.41 | | 12 day SMA | 134.94 | 134.8 | 134.58 | | 20 day SMA | 132.98 | 132.97 | 132.89 | | 35 day SMA | 130.53 | 130.42 | 130.24 | | 50 day SMA | 130.91 | 130.92 | 130.9 | | 100 day SMA | 124.71 | 124.56 | 124.41 | | 150 day SMA | 119.42 | 119.26 | 119.07 | | 200 day SMA | 117.22 | 117.14 | 117.07 |
|
|
