EnphaseEnergy ENPH full analysis,charts,indicators,moving averages,SMA,DMA,EMA,ADX,MACD,RSIEnphase Energy ENPH WideScreen charts, DMA,SMA,EMA technical analysis, forecast prediction, by indicators ADX,MACD,RSI,CCI NASDAQ stock exchange
operates under Technology sector & deals in Semiconductors
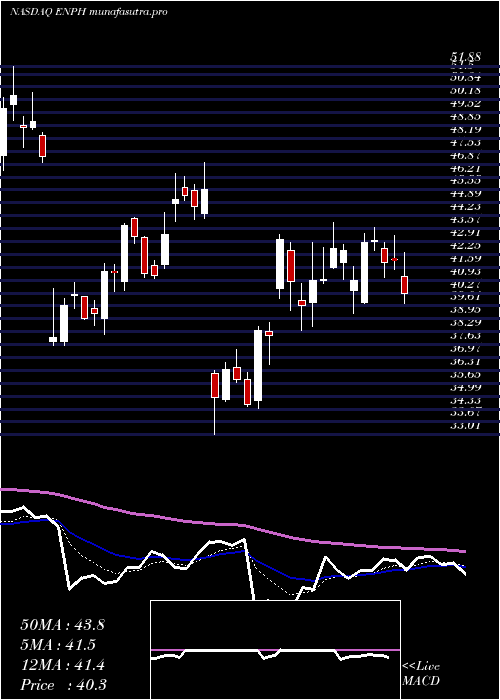
Daily price and charts and targets EnphaseEnergy Strong Daily Stock price targets for EnphaseEnergy ENPH are 30.81 and 33.17 | Daily Target 1 | 29.08 | | Daily Target 2 | 30.17 | | Daily Target 3 | 31.44 | | Daily Target 4 | 32.53 | | Daily Target 5 | 33.8 |
Daily price and volume Enphase Energy
| Date |
Closing |
Open |
Range |
Volume |
Fri 05 December 2025 |
31.26 (1.56%) |
30.76 |
30.35 - 32.71 |
1.4763 times |
Thu 04 December 2025 |
30.78 (4.73%) |
29.16 |
28.90 - 31.09 |
1.1496 times |
Wed 03 December 2025 |
29.39 (0.89%) |
29.35 |
28.70 - 29.60 |
1.04 times |
Tue 02 December 2025 |
29.13 (1.92%) |
28.59 |
28.51 - 29.64 |
0.7075 times |
Mon 01 December 2025 |
28.58 (-0.94%) |
28.30 |
28.13 - 29.43 |
1.5003 times |
Fri 28 November 2025 |
28.85 (3.67%) |
28.18 |
28.09 - 29.04 |
0.6254 times |
Wed 26 November 2025 |
27.83 (0.4%) |
27.84 |
27.63 - 28.32 |
0.6421 times |
Tue 25 November 2025 |
27.72 (3.55%) |
26.74 |
26.42 - 27.93 |
0.8952 times |
Mon 24 November 2025 |
26.77 (-0.59%) |
27.50 |
26.49 - 27.66 |
0.629 times |
Fri 21 November 2025 |
26.93 (3.1%) |
26.11 |
25.78 - 27.54 |
1.3347 times |
Thu 20 November 2025 |
26.12 (-2.86%) |
27.21 |
26.08 - 28.18 |
1.2356 times |
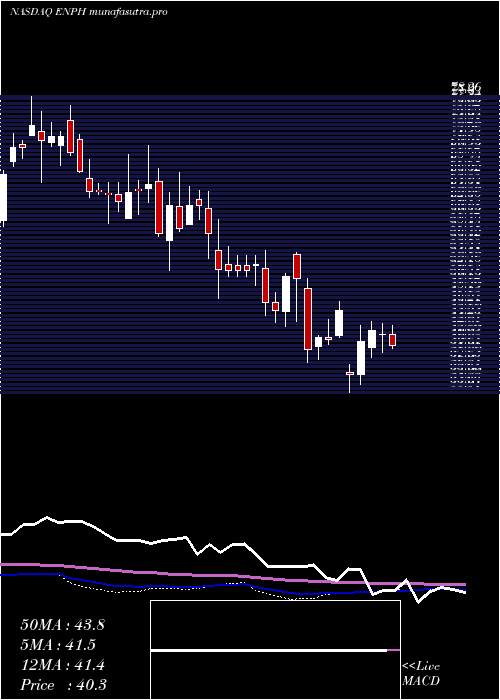
Weekly price and charts EnphaseEnergy Strong weekly Stock price targets for EnphaseEnergy ENPH are 29.7 and 34.28 | Weekly Target 1 | 26.12 | | Weekly Target 2 | 28.69 | | Weekly Target 3 | 30.7 | | Weekly Target 4 | 33.27 | | Weekly Target 5 | 35.28 |
Weekly price and volumes for Enphase Energy
| Date |
Closing |
Open |
Range |
Volume |
Fri 05 December 2025 |
31.26 (8.35%) |
28.30 |
28.13 - 32.71 |
0.9901 times |
Fri 28 November 2025 |
28.85 (7.13%) |
27.50 |
26.42 - 29.04 |
0.4706 times |
Fri 21 November 2025 |
26.93 (-6.1%) |
28.52 |
25.78 - 28.72 |
1.0128 times |
Fri 14 November 2025 |
28.68 (-5.06%) |
30.91 |
28.14 - 33.29 |
1.2868 times |
Fri 07 November 2025 |
30.21 (-0.98%) |
29.18 |
28.55 - 32.80 |
0.996 times |
Fri 31 October 2025 |
30.51 (0%) |
30.13 |
30.00 - 31.10 |
0.2829 times |
Fri 31 October 2025 |
30.51 (-15.83%) |
37.01 |
29.96 - 37.55 |
2.1445 times |
Fri 24 October 2025 |
36.25 (-1.2%) |
36.98 |
34.69 - 38.41 |
0.6455 times |
Fri 17 October 2025 |
36.69 (7.06%) |
34.85 |
34.17 - 39.55 |
0.9871 times |
Fri 10 October 2025 |
34.27 (-7.25%) |
37.10 |
33.57 - 39.22 |
1.1837 times |
Fri 03 October 2025 |
36.95 (1.23%) |
36.76 |
35.06 - 38.68 |
0.8942 times |
Monthly price and charts EnphaseEnergy Strong monthly Stock price targets for EnphaseEnergy ENPH are 29.7 and 34.28 | Monthly Target 1 | 26.12 | | Monthly Target 2 | 28.69 | | Monthly Target 3 | 30.7 | | Monthly Target 4 | 33.27 | | Monthly Target 5 | 35.28 |
Monthly price and volumes Enphase Energy
| Date |
Closing |
Open |
Range |
Volume |
Fri 05 December 2025 |
31.26 (8.35%) |
28.30 |
28.13 - 32.71 |
0.2161 times |
Fri 28 November 2025 |
28.85 (-5.44%) |
29.18 |
25.78 - 33.29 |
0.8218 times |
Fri 31 October 2025 |
30.51 (-13.79%) |
35.94 |
29.96 - 39.55 |
1.2472 times |
Tue 30 September 2025 |
35.39 (-6.13%) |
36.46 |
35.06 - 41.28 |
1.3147 times |
Fri 29 August 2025 |
37.70 (16.5%) |
32.44 |
29.89 - 39.57 |
1.1916 times |
Thu 31 July 2025 |
32.36 (-18.39%) |
39.81 |
31.98 - 43.89 |
1.4361 times |
Mon 30 June 2025 |
39.65 (-4.2%) |
41.39 |
33.01 - 46.94 |
1.3548 times |
Fri 30 May 2025 |
41.39 (-7.18%) |
44.74 |
37.59 - 54.43 |
1.2924 times |
Wed 30 April 2025 |
44.59 (-28.14%) |
62.23 |
44.21 - 63.70 |
0.5856 times |
Mon 31 March 2025 |
62.05 (8.23%) |
56.23 |
51.63 - 66.70 |
0.5399 times |
Fri 28 February 2025 |
57.33 (-7.95%) |
59.60 |
56.83 - 70.78 |
0.6995 times |
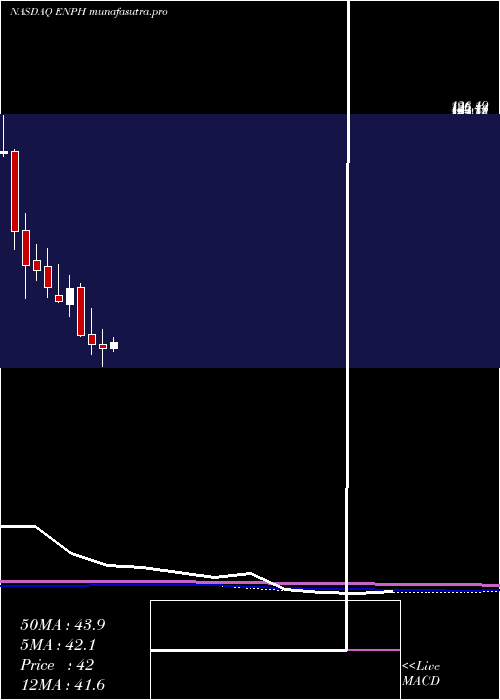
DMA SMA EMA moving averages of Enphase Energy ENPH
DMA (daily moving average) of Enphase Energy ENPH
| DMA period | DMA value | | 5 day DMA | 29.83 | | 12 day DMA | 28.35 | | 20 day DMA | 28.88 | | 35 day DMA | 31 | | 50 day DMA | 32.63 | | 100 day DMA | 34.5 | | 150 day DMA | 37.24 | | 200 day DMA | 42.12 | EMA (exponential moving average) of Enphase Energy ENPH
| EMA period | EMA current | EMA prev | EMA prev2 | | 5 day EMA | 30.05 | 29.45 | 28.78 | | 12 day EMA | 29.31 | 28.95 | 28.62 | | 20 day EMA | 29.6 | 29.42 | 29.28 | | 35 day EMA | 31.01 | 30.99 | 31 | | 50 day EMA | 32.82 | 32.88 | 32.97 |
SMA (simple moving average) of Enphase Energy ENPH
| SMA period | SMA current | SMA prev | SMA prev2 | | 5 day SMA | 29.83 | 29.35 | 28.76 | | 12 day SMA | 28.35 | 28.05 | 27.78 | | 20 day SMA | 28.88 | 28.87 | 28.95 | | 35 day SMA | 31 | 31.17 | 31.37 | | 50 day SMA | 32.63 | 32.74 | 32.89 | | 100 day SMA | 34.5 | 34.58 | 34.67 | | 150 day SMA | 37.24 | 37.32 | 37.42 | | 200 day SMA | 42.12 | 42.3 | 42.47 |
|
|
