EhealthInc EHTH full analysis,charts,indicators,moving averages,SMA,DMA,EMA,ADX,MACD,RSIEhealth Inc EHTH WideScreen charts, DMA,SMA,EMA technical analysis, forecast prediction, by indicators ADX,MACD,RSI,CCI NASDAQ stock exchange
operates under Finance sector & deals in Specialty Insurers
Daily price and charts and targets EhealthInc Strong Daily Stock price targets for EhealthInc EHTH are 3.61 and 3.98 | Daily Target 1 | 3.54 | | Daily Target 2 | 3.67 | | Daily Target 3 | 3.9066666666667 | | Daily Target 4 | 4.04 | | Daily Target 5 | 4.28 |
Daily price and volume Ehealth Inc
| Date |
Closing |
Open |
Range |
Volume |
Fri 05 December 2025 |
3.81 (-7.07%) |
4.11 |
3.77 - 4.14 |
0.8755 times |
Thu 04 December 2025 |
4.10 (-1.44%) |
4.16 |
4.00 - 4.20 |
0.9174 times |
Wed 03 December 2025 |
4.16 (3.23%) |
4.04 |
4.04 - 4.25 |
0.8751 times |
Tue 02 December 2025 |
4.03 (1.77%) |
4.00 |
3.93 - 4.07 |
0.7443 times |
Mon 01 December 2025 |
3.96 (-2.94%) |
3.95 |
3.90 - 4.08 |
1.432 times |
Fri 28 November 2025 |
4.08 (0.25%) |
4.08 |
4.03 - 4.17 |
0.2334 times |
Wed 26 November 2025 |
4.07 (2.78%) |
3.96 |
3.84 - 4.21 |
0.9814 times |
Tue 25 November 2025 |
3.96 (9.7%) |
3.59 |
3.58 - 3.98 |
1.575 times |
Mon 24 November 2025 |
3.61 (4.03%) |
3.47 |
3.46 - 3.63 |
1.0214 times |
Fri 21 November 2025 |
3.47 (4.52%) |
3.31 |
3.30 - 3.60 |
1.3445 times |
Thu 20 November 2025 |
3.32 (-7.78%) |
3.69 |
3.30 - 3.73 |
1.0608 times |
Weekly price and charts EhealthInc Strong weekly Stock price targets for EhealthInc EHTH are 3.55 and 4.03 | Weekly Target 1 | 3.46 | | Weekly Target 2 | 3.64 | | Weekly Target 3 | 3.9433333333333 | | Weekly Target 4 | 4.12 | | Weekly Target 5 | 4.42 |
Weekly price and volumes for Ehealth Inc
| Date |
Closing |
Open |
Range |
Volume |
Fri 05 December 2025 |
3.81 (-6.62%) |
3.95 |
3.77 - 4.25 |
0.8281 times |
Fri 28 November 2025 |
4.08 (17.58%) |
3.47 |
3.46 - 4.21 |
0.6515 times |
Fri 21 November 2025 |
3.47 (-9.16%) |
3.80 |
3.30 - 3.97 |
0.9212 times |
Fri 14 November 2025 |
3.82 (-6.37%) |
4.13 |
3.76 - 4.29 |
0.825 times |
Fri 07 November 2025 |
4.08 (-21.39%) |
5.10 |
3.67 - 5.27 |
1.3367 times |
Fri 31 October 2025 |
5.19 (0%) |
5.04 |
4.88 - 5.22 |
0.1654 times |
Fri 31 October 2025 |
5.19 (-1.7%) |
5.41 |
4.88 - 5.89 |
1.6411 times |
Fri 24 October 2025 |
5.28 (10.69%) |
4.87 |
4.79 - 5.38 |
1.0689 times |
Fri 17 October 2025 |
4.77 (7.67%) |
4.46 |
4.21 - 5.35 |
1.0911 times |
Fri 10 October 2025 |
4.43 (-1.56%) |
4.50 |
4.42 - 5.34 |
1.471 times |
Fri 03 October 2025 |
4.50 (14.21%) |
3.98 |
3.83 - 4.55 |
1.152 times |

Monthly price and charts EhealthInc Strong monthly Stock price targets for EhealthInc EHTH are 3.55 and 4.03 | Monthly Target 1 | 3.46 | | Monthly Target 2 | 3.64 | | Monthly Target 3 | 3.9433333333333 | | Monthly Target 4 | 4.12 | | Monthly Target 5 | 4.42 |
Monthly price and volumes Ehealth Inc
| Date |
Closing |
Open |
Range |
Volume |
Fri 05 December 2025 |
3.81 (-6.62%) |
3.95 |
3.77 - 4.25 |
0.1891 times |
Fri 28 November 2025 |
4.08 (-21.39%) |
5.10 |
3.30 - 5.27 |
0.8529 times |
Fri 31 October 2025 |
5.19 (20.42%) |
4.31 |
4.03 - 5.89 |
1.3677 times |
Tue 30 September 2025 |
4.31 (11.37%) |
3.82 |
3.75 - 4.39 |
0.8236 times |
Fri 29 August 2025 |
3.87 (13.82%) |
3.38 |
3.20 - 4.91 |
1.9386 times |
Thu 31 July 2025 |
3.40 (-21.84%) |
4.31 |
3.32 - 4.42 |
1.1198 times |
Mon 30 June 2025 |
4.35 (6.1%) |
4.11 |
3.85 - 4.55 |
1.218 times |
Fri 30 May 2025 |
4.10 (-26.26%) |
5.66 |
4.05 - 7.09 |
1.354 times |
Wed 30 April 2025 |
5.56 (-16.77%) |
6.64 |
5.33 - 6.79 |
0.4709 times |
Mon 31 March 2025 |
6.68 (-24.18%) |
8.94 |
6.48 - 9.24 |
0.6654 times |
Fri 28 February 2025 |
8.81 (-11.37%) |
9.71 |
7.79 - 11.36 |
0.9059 times |

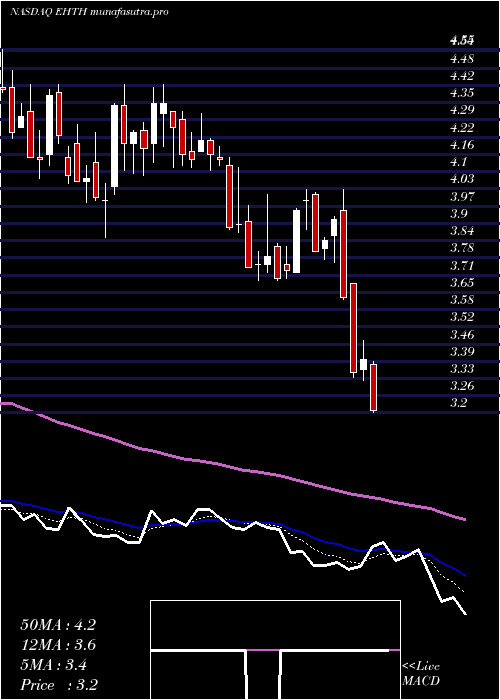
DMA SMA EMA moving averages of Ehealth Inc EHTH
DMA (daily moving average) of Ehealth Inc EHTH
| DMA period | DMA value | | 5 day DMA | 4.01 | | 12 day DMA | 3.85 | | 20 day DMA | 3.9 | | 35 day DMA | 4.4 | | 50 day DMA | 4.44 | | 100 day DMA | 4.12 | | 150 day DMA | 4.21 | | 200 day DMA | 4.91 | EMA (exponential moving average) of Ehealth Inc EHTH
| EMA period | EMA current | EMA prev | EMA prev2 | | 5 day EMA | 3.97 | 4.05 | 4.03 | | 12 day EMA | 3.97 | 4 | 3.98 | | 20 day EMA | 4.05 | 4.07 | 4.07 | | 35 day EMA | 4.15 | 4.17 | 4.17 | | 50 day EMA | 4.36 | 4.38 | 4.39 |
SMA (simple moving average) of Ehealth Inc EHTH
| SMA period | SMA current | SMA prev | SMA prev2 | | 5 day SMA | 4.01 | 4.07 | 4.06 | | 12 day SMA | 3.85 | 3.84 | 3.82 | | 20 day SMA | 3.9 | 3.9 | 3.94 | | 35 day SMA | 4.4 | 4.43 | 4.45 | | 50 day SMA | 4.44 | 4.44 | 4.44 | | 100 day SMA | 4.12 | 4.11 | 4.11 | | 150 day SMA | 4.21 | 4.22 | 4.23 | | 200 day SMA | 4.91 | 4.95 | 4.98 |
|
|
