EnterpriseFinancial EFSC full analysis,charts,indicators,moving averages,SMA,DMA,EMA,ADX,MACD,RSIEnterprise Financial EFSC WideScreen charts, DMA,SMA,EMA technical analysis, forecast prediction, by indicators ADX,MACD,RSI,CCI NASDAQ stock exchange
operates under Finance sector & deals in Major Banks
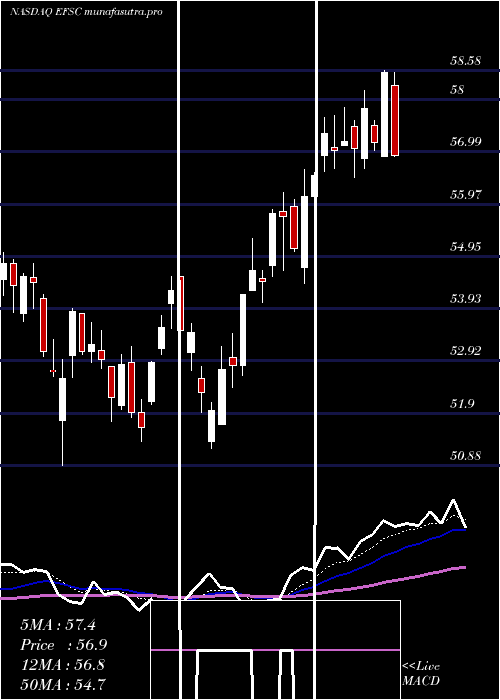
Daily price and charts and targets EnterpriseFinancial Strong Daily Stock price targets for EnterpriseFinancial EFSC are 54.75 and 55.55 | Daily Target 1 | 54.59 | | Daily Target 2 | 54.91 | | Daily Target 3 | 55.393333333333 | | Daily Target 4 | 55.71 | | Daily Target 5 | 56.19 |
Daily price and volume Enterprise Financial
| Date |
Closing |
Open |
Range |
Volume |
Fri 05 December 2025 |
55.22 (-0.9%) |
55.43 |
55.08 - 55.88 |
1.2428 times |
Thu 04 December 2025 |
55.72 (-0.25%) |
55.53 |
54.39 - 56.21 |
0.7623 times |
Wed 03 December 2025 |
55.86 (2.01%) |
55.04 |
54.04 - 55.99 |
1.5983 times |
Tue 02 December 2025 |
54.76 (-0.73%) |
55.55 |
54.66 - 55.72 |
0.8154 times |
Mon 01 December 2025 |
55.16 (1.01%) |
54.24 |
54.24 - 55.50 |
0.9019 times |
Fri 28 November 2025 |
54.61 (-0.73%) |
54.99 |
54.39 - 55.38 |
0.4548 times |
Wed 26 November 2025 |
55.01 (-0.63%) |
55.07 |
54.82 - 55.46 |
0.9156 times |
Tue 25 November 2025 |
55.36 (2.9%) |
54.08 |
54.08 - 55.56 |
1.2206 times |
Mon 24 November 2025 |
53.80 (-0.5%) |
53.87 |
53.30 - 54.26 |
0.8557 times |
Fri 21 November 2025 |
54.07 (2.79%) |
52.74 |
51.88 - 54.72 |
1.2325 times |
Thu 20 November 2025 |
52.60 (0.11%) |
52.96 |
52.24 - 53.62 |
1.021 times |
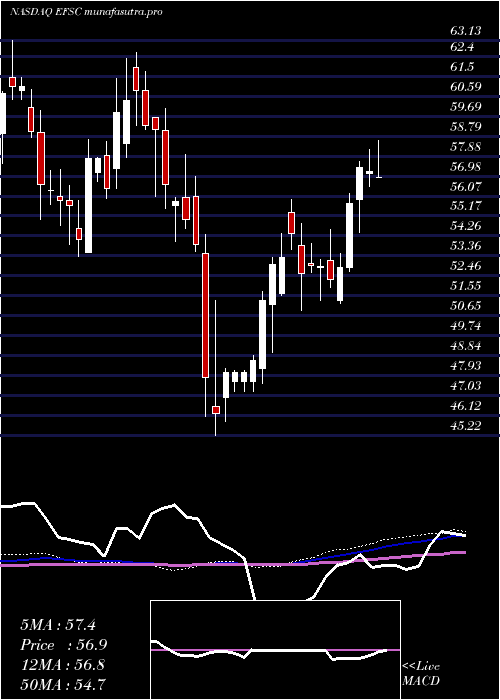
Weekly price and charts EnterpriseFinancial Strong weekly Stock price targets for EnterpriseFinancial EFSC are 54.63 and 56.8 | Weekly Target 1 | 52.99 | | Weekly Target 2 | 54.1 | | Weekly Target 3 | 55.156666666667 | | Weekly Target 4 | 56.27 | | Weekly Target 5 | 57.33 |
Weekly price and volumes for Enterprise Financial
| Date |
Closing |
Open |
Range |
Volume |
Fri 05 December 2025 |
55.22 (1.12%) |
54.24 |
54.04 - 56.21 |
0.9267 times |
Fri 28 November 2025 |
54.61 (1%) |
53.87 |
53.30 - 55.56 |
0.6003 times |
Fri 21 November 2025 |
54.07 (1.12%) |
53.32 |
51.81 - 54.72 |
1.0382 times |
Fri 14 November 2025 |
53.47 (1.38%) |
53.06 |
51.18 - 54.00 |
1.0795 times |
Fri 07 November 2025 |
52.74 (0.71%) |
52.14 |
51.77 - 53.97 |
0.8823 times |
Fri 31 October 2025 |
52.37 (0%) |
52.49 |
51.96 - 52.84 |
0.309 times |
Fri 31 October 2025 |
52.37 (-5.42%) |
55.39 |
51.96 - 56.60 |
1.3395 times |
Fri 24 October 2025 |
55.37 (4.24%) |
53.66 |
53.29 - 56.45 |
1.17 times |
Fri 17 October 2025 |
53.12 (-3.38%) |
55.65 |
52.62 - 58.24 |
1.8169 times |
Fri 10 October 2025 |
54.98 (-4.38%) |
57.80 |
54.95 - 58.81 |
0.8377 times |
Fri 03 October 2025 |
57.50 (-2.28%) |
58.91 |
56.80 - 60.01 |
0.8355 times |
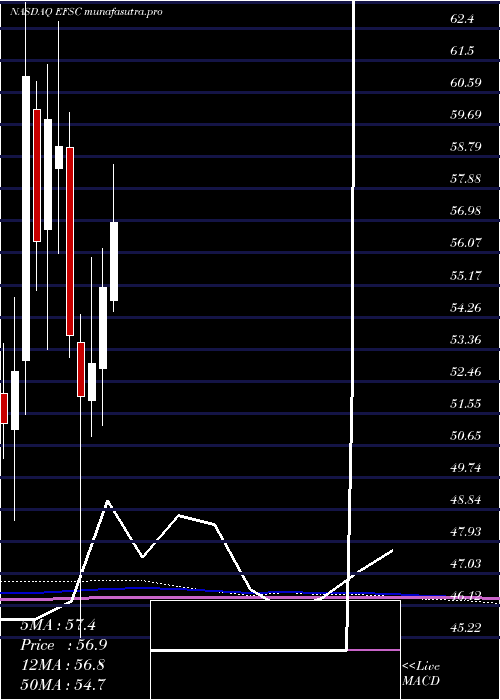
Monthly price and charts EnterpriseFinancial Strong monthly Stock price targets for EnterpriseFinancial EFSC are 54.63 and 56.8 | Monthly Target 1 | 52.99 | | Monthly Target 2 | 54.1 | | Monthly Target 3 | 55.156666666667 | | Monthly Target 4 | 56.27 | | Monthly Target 5 | 57.33 |
Monthly price and volumes Enterprise Financial
| Date |
Closing |
Open |
Range |
Volume |
Fri 05 December 2025 |
55.22 (1.12%) |
54.24 |
54.04 - 56.21 |
0.1735 times |
Fri 28 November 2025 |
54.61 (4.28%) |
52.14 |
51.18 - 55.56 |
0.674 times |
Fri 31 October 2025 |
52.37 (-9.68%) |
57.57 |
51.96 - 58.81 |
1.1106 times |
Tue 30 September 2025 |
57.98 (-5.32%) |
60.51 |
57.53 - 62.20 |
1.0045 times |
Fri 29 August 2025 |
61.24 (10.96%) |
54.88 |
53.53 - 62.30 |
0.8421 times |
Thu 31 July 2025 |
55.19 (0.16%) |
54.73 |
54.42 - 59.38 |
1.089 times |
Mon 30 June 2025 |
55.10 (4.08%) |
52.81 |
51.21 - 56.20 |
1.0296 times |
Fri 30 May 2025 |
52.94 (1.77%) |
51.90 |
50.88 - 55.93 |
0.9195 times |
Wed 30 April 2025 |
52.02 (-3.2%) |
53.55 |
45.22 - 54.34 |
1.2453 times |
Mon 31 March 2025 |
53.74 (-9.04%) |
59.05 |
53.13 - 60.04 |
1.912 times |
Fri 28 February 2025 |
59.08 (-1.27%) |
58.47 |
56.05 - 62.60 |
0.9681 times |
DMA SMA EMA moving averages of Enterprise Financial EFSC
DMA (daily moving average) of Enterprise Financial EFSC
| DMA period | DMA value | | 5 day DMA | 55.34 | | 12 day DMA | 54.56 | | 20 day DMA | 53.89 | | 35 day DMA | 53.84 | | 50 day DMA | 54.79 | | 100 day DMA | 56.64 | | 150 day DMA | 55.88 | | 200 day DMA | 55.21 | EMA (exponential moving average) of Enterprise Financial EFSC
| EMA period | EMA current | EMA prev | EMA prev2 | | 5 day EMA | 55.27 | 55.3 | 55.09 | | 12 day EMA | 54.73 | 54.64 | 54.44 | | 20 day EMA | 54.44 | 54.36 | 54.22 | | 35 day EMA | 54.77 | 54.74 | 54.68 | | 50 day EMA | 55.22 | 55.22 | 55.2 |
SMA (simple moving average) of Enterprise Financial EFSC
| SMA period | SMA current | SMA prev | SMA prev2 | | 5 day SMA | 55.34 | 55.22 | 55.08 | | 12 day SMA | 54.56 | 54.31 | 54 | | 20 day SMA | 53.89 | 53.78 | 53.68 | | 35 day SMA | 53.84 | 53.78 | 53.8 | | 50 day SMA | 54.79 | 54.86 | 54.92 | | 100 day SMA | 56.64 | 56.66 | 56.68 | | 150 day SMA | 55.88 | 55.86 | 55.83 | | 200 day SMA | 55.21 | 55.24 | 55.26 |
|
|
