EdesaBiotech EDSA full analysis,charts,indicators,moving averages,SMA,DMA,EMA,ADX,MACD,RSIEdesa Biotech EDSA WideScreen charts, DMA,SMA,EMA technical analysis, forecast prediction, by indicators ADX,MACD,RSI,CCI NASDAQ stock exchange
Daily price and charts and targets EdesaBiotech Strong Daily Stock price targets for EdesaBiotech EDSA are 2.05 and 2.39 | Daily Target 1 | 1.77 | | Daily Target 2 | 1.98 | | Daily Target 3 | 2.1066666666667 | | Daily Target 4 | 2.32 | | Daily Target 5 | 2.45 |
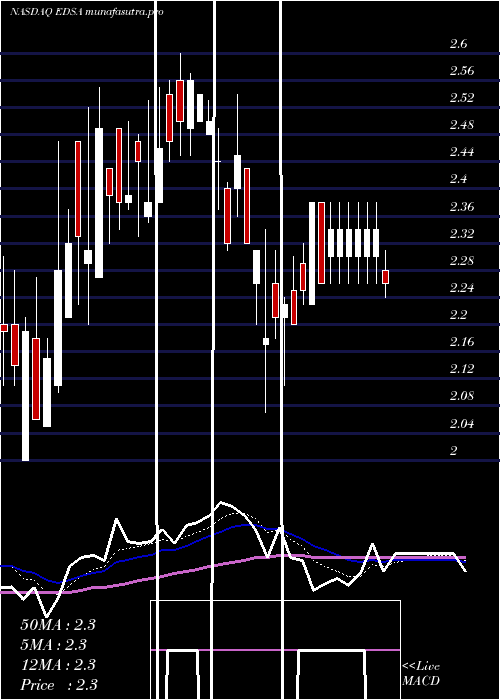
Daily price and volume Edesa Biotech
| Date |
Closing |
Open |
Range |
Volume |
Mon 14 July 2025 |
2.20 (5.26%) |
2.16 |
1.89 - 2.23 |
6.2811 times |
Fri 11 July 2025 |
2.09 (0.97%) |
2.07 |
2.05 - 2.17 |
0.6139 times |
Thu 10 July 2025 |
2.07 (-1.9%) |
2.11 |
2.07 - 2.12 |
0.252 times |
Wed 09 July 2025 |
2.11 (2.93%) |
2.05 |
2.05 - 2.12 |
0.2973 times |
Tue 08 July 2025 |
2.05 (-0.49%) |
2.09 |
2.05 - 2.12 |
1.0985 times |
Mon 07 July 2025 |
2.06 (-0.96%) |
2.03 |
2.03 - 2.09 |
0.1163 times |
Thu 03 July 2025 |
2.08 (1.96%) |
2.08 |
2.08 - 2.10 |
0.084 times |
Wed 02 July 2025 |
2.04 (0.49%) |
2.09 |
2.04 - 2.11 |
0.8368 times |
Tue 01 July 2025 |
2.03 (0%) |
1.99 |
1.99 - 2.07 |
0.1842 times |
Mon 30 June 2025 |
2.03 (-0.98%) |
2.07 |
2.01 - 2.07 |
0.2359 times |
Fri 27 June 2025 |
2.05 (5.13%) |
1.96 |
1.96 - 2.05 |
0.0905 times |
Weekly price and charts EdesaBiotech Strong weekly Stock price targets for EdesaBiotech EDSA are 2.05 and 2.39 | Weekly Target 1 | 1.77 | | Weekly Target 2 | 1.98 | | Weekly Target 3 | 2.1066666666667 | | Weekly Target 4 | 2.32 | | Weekly Target 5 | 2.45 |
Weekly price and volumes for Edesa Biotech
| Date |
Closing |
Open |
Range |
Volume |
Mon 14 July 2025 |
2.20 (5.26%) |
2.16 |
1.89 - 2.23 |
1.6749 times |
Fri 11 July 2025 |
2.09 (0.48%) |
2.03 |
2.03 - 2.17 |
0.6341 times |
Thu 03 July 2025 |
2.08 (1.46%) |
2.07 |
1.99 - 2.11 |
0.3575 times |
Fri 27 June 2025 |
2.05 (4.59%) |
1.96 |
1.87 - 2.14 |
0.5884 times |
Fri 20 June 2025 |
1.96 (2.08%) |
2.06 |
1.96 - 2.16 |
0.3412 times |
Fri 13 June 2025 |
1.92 (4.92%) |
1.85 |
1.85 - 1.96 |
0.6212 times |
Fri 06 June 2025 |
1.83 (-6.63%) |
1.96 |
1.83 - 2.05 |
0.9839 times |
Fri 30 May 2025 |
1.96 (0%) |
1.96 |
1.88 - 2.06 |
3.4229 times |
Fri 23 May 2025 |
1.96 (-3.45%) |
2.03 |
1.96 - 2.09 |
0.5247 times |
Fri 16 May 2025 |
2.03 (-0.98%) |
2.04 |
1.93 - 2.14 |
0.8512 times |
Fri 09 May 2025 |
2.05 (-13.87%) |
2.38 |
1.94 - 2.40 |
1.0244 times |

Monthly price and charts EdesaBiotech Strong monthly Stock price targets for EdesaBiotech EDSA are 2.05 and 2.39 | Monthly Target 1 | 1.77 | | Monthly Target 2 | 1.98 | | Monthly Target 3 | 2.1066666666667 | | Monthly Target 4 | 2.32 | | Monthly Target 5 | 2.45 |
Monthly price and volumes Edesa Biotech
| Date |
Closing |
Open |
Range |
Volume |
Mon 14 July 2025 |
2.20 (8.37%) |
1.99 |
1.89 - 2.23 |
0.0247 times |
Mon 30 June 2025 |
2.03 (3.57%) |
1.96 |
1.83 - 2.16 |
0.0246 times |
Fri 30 May 2025 |
1.96 (-15.88%) |
2.35 |
1.88 - 2.40 |
0.0558 times |
Wed 30 April 2025 |
2.33 (-4.51%) |
2.40 |
2.07 - 2.54 |
0.0134 times |
Mon 31 March 2025 |
2.44 (11.42%) |
2.18 |
2.05 - 2.60 |
0.0582 times |
Fri 28 February 2025 |
2.19 (14.66%) |
1.83 |
1.83 - 4.49 |
9.6318 times |
Fri 31 January 2025 |
1.91 (13.69%) |
1.83 |
1.56 - 2.40 |
0.0476 times |
Tue 31 December 2024 |
1.68 (-23.98%) |
1.86 |
1.58 - 1.99 |
0.03 times |
Tue 26 November 2024 |
2.21 (-33.03%) |
3.45 |
2.05 - 3.45 |
0.0841 times |
Thu 31 October 2024 |
3.30 (-25.84%) |
4.36 |
3.20 - 5.00 |
0.0298 times |
Mon 30 September 2024 |
4.45 (-1.11%) |
4.40 |
4.02 - 4.60 |
0.0099 times |

DMA SMA EMA moving averages of Edesa Biotech EDSA
DMA (daily moving average) of Edesa Biotech EDSA
| DMA period | DMA value | | 5 day DMA | 2.1 | | 12 day DMA | 2.06 | | 20 day DMA | 2.03 | | 35 day DMA | 2 | | 50 day DMA | 2.05 | | 100 day DMA | 2.19 | | 150 day DMA | 2.1 | | 200 day DMA | 2.43 | EMA (exponential moving average) of Edesa Biotech EDSA
| EMA period | EMA current | EMA prev | EMA prev2 | | 5 day EMA | 2.12 | 2.08 | 2.07 | | 12 day EMA | 2.07 | 2.05 | 2.04 | | 20 day EMA | 2.05 | 2.03 | 2.02 | | 35 day EMA | 2.07 | 2.06 | 2.06 | | 50 day EMA | 2.08 | 2.07 | 2.07 |
SMA (simple moving average) of Edesa Biotech EDSA
| SMA period | SMA current | SMA prev | SMA prev2 | | 5 day SMA | 2.1 | 2.08 | 2.07 | | 12 day SMA | 2.06 | 2.05 | 2.04 | | 20 day SMA | 2.03 | 2.02 | 2.01 | | 35 day SMA | 2 | 2 | 1.99 | | 50 day SMA | 2.05 | 2.05 | 2.06 | | 100 day SMA | 2.19 | 2.2 | 2.2 | | 150 day SMA | 2.1 | 2.1 | 2.1 | | 200 day SMA | 2.43 | 2.44 | 2.45 |
|
|
