EnterpriseBancorp EBTC full analysis,charts,indicators,moving averages,SMA,DMA,EMA,ADX,MACD,RSIEnterprise Bancorp EBTC WideScreen charts, DMA,SMA,EMA technical analysis, forecast prediction, by indicators ADX,MACD,RSI,CCI NASDAQ stock exchange
operates under Finance sector & deals in Major Banks
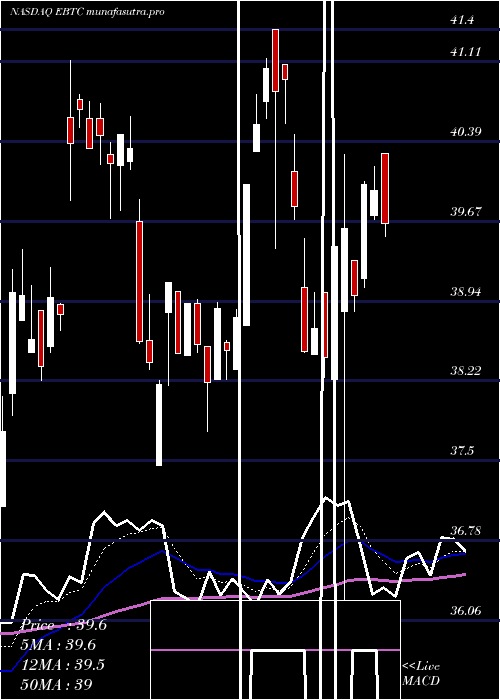
Daily price and charts and targets EnterpriseBancorp Strong Daily Stock price targets for EnterpriseBancorp EBTC are 39.21 and 39.96 | Daily Target 1 | 39.07 | | Daily Target 2 | 39.35 | | Daily Target 3 | 39.816666666667 | | Daily Target 4 | 40.1 | | Daily Target 5 | 40.57 |
Daily price and volume Enterprise Bancorp
| Date |
Closing |
Open |
Range |
Volume |
Mon 30 June 2025 |
39.64 (-0.75%) |
40.28 |
39.53 - 40.28 |
1.8696 times |
Fri 27 June 2025 |
39.94 (-0.15%) |
39.72 |
39.68 - 40.16 |
1.8276 times |
Thu 26 June 2025 |
40.00 (2.59%) |
39.15 |
39.07 - 40.02 |
0.7233 times |
Wed 25 June 2025 |
38.99 (-1.54%) |
39.31 |
38.85 - 39.31 |
0.6652 times |
Tue 24 June 2025 |
39.60 (0.41%) |
38.85 |
36.06 - 40.27 |
0.917 times |
Mon 23 June 2025 |
39.44 (2.63%) |
38.24 |
38.20 - 39.45 |
0.6942 times |
Fri 20 June 2025 |
38.43 (-0.67%) |
39.02 |
38.25 - 39.02 |
1.4272 times |
Wed 18 June 2025 |
38.69 (0.52%) |
38.46 |
38.46 - 39.02 |
0.6103 times |
Tue 17 June 2025 |
38.49 (-3.29%) |
39.07 |
38.48 - 39.51 |
0.6781 times |
Fri 13 June 2025 |
39.80 (-2.78%) |
40.11 |
39.68 - 40.45 |
0.5877 times |
Thu 12 June 2025 |
40.94 (0.24%) |
41.08 |
40.55 - 41.08 |
0.3713 times |
Weekly price and charts EnterpriseBancorp Strong weekly Stock price targets for EnterpriseBancorp EBTC are 39.21 and 39.96 | Weekly Target 1 | 39.07 | | Weekly Target 2 | 39.35 | | Weekly Target 3 | 39.816666666667 | | Weekly Target 4 | 40.1 | | Weekly Target 5 | 40.57 |
Weekly price and volumes for Enterprise Bancorp
| Date |
Closing |
Open |
Range |
Volume |
Mon 30 June 2025 |
39.64 (-0.75%) |
40.28 |
39.53 - 40.28 |
0.556 times |
Fri 27 June 2025 |
39.94 (3.93%) |
38.24 |
36.06 - 40.27 |
1.4356 times |
Fri 20 June 2025 |
38.43 (-3.44%) |
39.07 |
38.25 - 39.51 |
0.8076 times |
Fri 13 June 2025 |
39.80 (-0.5%) |
40.29 |
39.42 - 41.40 |
0.8364 times |
Fri 06 June 2025 |
40.00 (3.76%) |
38.53 |
37.77 - 40.00 |
0.9823 times |
Fri 30 May 2025 |
38.55 (0.94%) |
38.84 |
38.18 - 39.11 |
0.798 times |
Fri 23 May 2025 |
38.19 (-4.98%) |
40.17 |
37.46 - 40.61 |
0.7682 times |
Fri 16 May 2025 |
40.19 (3.53%) |
40.60 |
39.69 - 41.12 |
2.1001 times |
Fri 09 May 2025 |
38.82 (-0.51%) |
38.77 |
38.23 - 39.41 |
0.6309 times |
Fri 02 May 2025 |
39.02 (6.44%) |
36.65 |
36.21 - 39.23 |
1.0851 times |
Fri 25 April 2025 |
36.66 (4.65%) |
35.02 |
34.05 - 37.00 |
0.6933 times |

Monthly price and charts EnterpriseBancorp Strong monthly Stock price targets for EnterpriseBancorp EBTC are 37.85 and 43.19 | Monthly Target 1 | 33.69 | | Monthly Target 2 | 36.67 | | Monthly Target 3 | 39.033333333333 | | Monthly Target 4 | 42.01 | | Monthly Target 5 | 44.37 |
Monthly price and volumes Enterprise Bancorp
| Date |
Closing |
Open |
Range |
Volume |
Mon 30 June 2025 |
39.64 (2.83%) |
38.53 |
36.06 - 41.40 |
0.779 times |
Fri 30 May 2025 |
38.55 (3.63%) |
37.09 |
37.09 - 41.12 |
0.799 times |
Wed 30 April 2025 |
37.20 (-4.44%) |
38.55 |
32.86 - 39.14 |
1.0005 times |
Mon 31 March 2025 |
38.93 (-9.78%) |
43.29 |
37.58 - 43.65 |
1.0971 times |
Fri 28 February 2025 |
43.15 (1.94%) |
41.42 |
38.45 - 44.41 |
0.9253 times |
Fri 31 January 2025 |
42.33 (7.06%) |
39.62 |
36.69 - 43.38 |
1.5472 times |
Tue 31 December 2024 |
39.54 (7.74%) |
43.84 |
39.13 - 44.07 |
1.7909 times |
Tue 26 November 2024 |
36.70 (14.29%) |
31.60 |
31.25 - 39.37 |
0.5934 times |
Thu 31 October 2024 |
32.11 (0.47%) |
32.02 |
30.49 - 34.03 |
0.5922 times |
Mon 30 September 2024 |
31.96 (3.13%) |
30.72 |
29.38 - 32.77 |
0.8754 times |
Fri 30 August 2024 |
30.99 (4.87%) |
28.95 |
25.49 - 31.16 |
0.8306 times |

DMA SMA EMA moving averages of Enterprise Bancorp EBTC
DMA (daily moving average) of Enterprise Bancorp EBTC
| DMA period | DMA value | | 5 day DMA | 39.63 | | 12 day DMA | 39.57 | | 20 day DMA | 39.47 | | 35 day DMA | 39.47 | | 50 day DMA | 38.68 | | 100 day DMA | 39.14 | | 150 day DMA | 39.42 | | 200 day DMA | 37.68 | EMA (exponential moving average) of Enterprise Bancorp EBTC
| EMA period | EMA current | EMA prev | EMA prev2 | | 5 day EMA | 39.63 | 39.63 | 39.47 | | 12 day EMA | 39.54 | 39.52 | 39.44 | | 20 day EMA | 39.4 | 39.38 | 39.32 | | 35 day EMA | 38.92 | 38.88 | 38.82 | | 50 day EMA | 38.46 | 38.41 | 38.35 |
SMA (simple moving average) of Enterprise Bancorp EBTC
| SMA period | SMA current | SMA prev | SMA prev2 | | 5 day SMA | 39.63 | 39.59 | 39.29 | | 12 day SMA | 39.57 | 39.68 | 39.73 | | 20 day SMA | 39.47 | 39.43 | 39.36 | | 35 day SMA | 39.47 | 39.44 | 39.4 | | 50 day SMA | 38.68 | 38.59 | 38.49 | | 100 day SMA | 39.14 | 39.18 | 39.19 | | 150 day SMA | 39.42 | 39.41 | 39.39 | | 200 day SMA | 37.68 | 37.63 | 37.58 |
|
|
