EbangInternational EBON full analysis,charts,indicators,moving averages,SMA,DMA,EMA,ADX,MACD,RSIEbang International EBON WideScreen charts, DMA,SMA,EMA technical analysis, forecast prediction, by indicators ADX,MACD,RSI,CCI NASDAQ stock exchange
Daily price and charts and targets EbangInternational Strong Daily Stock price targets for EbangInternational EBON are 4.94 and 5.65 | Daily Target 1 | 4.38 | | Daily Target 2 | 4.79 | | Daily Target 3 | 5.0933333333333 | | Daily Target 4 | 5.5 | | Daily Target 5 | 5.8 |
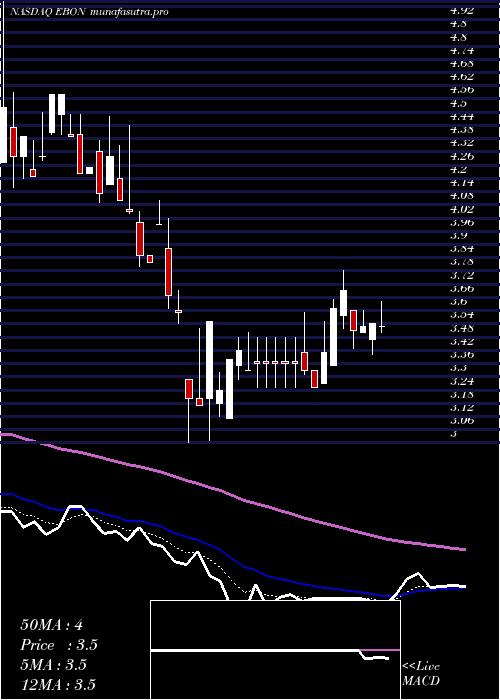
Daily price and volume Ebang International
| Date |
Closing |
Open |
Range |
Volume |
Fri 11 July 2025 |
5.19 (11.13%) |
4.84 |
4.69 - 5.40 |
2.639 times |
Thu 10 July 2025 |
4.67 (37.76%) |
3.47 |
3.44 - 4.74 |
5.3305 times |
Wed 09 July 2025 |
3.39 (0.59%) |
3.46 |
3.33 - 3.47 |
0.0927 times |
Tue 08 July 2025 |
3.37 (-0.59%) |
3.35 |
3.28 - 3.49 |
0.0927 times |
Mon 07 July 2025 |
3.39 (0.3%) |
3.30 |
3.30 - 3.40 |
0.0874 times |
Thu 03 July 2025 |
3.38 (-3.15%) |
3.50 |
3.17 - 3.50 |
0.8132 times |
Wed 02 July 2025 |
3.49 (5.76%) |
3.42 |
3.28 - 3.50 |
0.6978 times |
Tue 01 July 2025 |
3.30 (0%) |
3.45 |
3.30 - 3.50 |
0.1049 times |
Mon 30 June 2025 |
3.30 (-0.3%) |
3.31 |
3.30 - 3.37 |
0.049 times |
Fri 27 June 2025 |
3.31 (1.22%) |
3.27 |
3.27 - 3.60 |
0.0927 times |
Thu 26 June 2025 |
3.27 (-2.39%) |
3.34 |
3.27 - 3.35 |
0.1259 times |
Weekly price and charts EbangInternational Strong weekly Stock price targets for EbangInternational EBON are 4.24 and 6.36 | Weekly Target 1 | 2.5 | | Weekly Target 2 | 3.85 | | Weekly Target 3 | 4.6233333333333 | | Weekly Target 4 | 5.97 | | Weekly Target 5 | 6.74 |
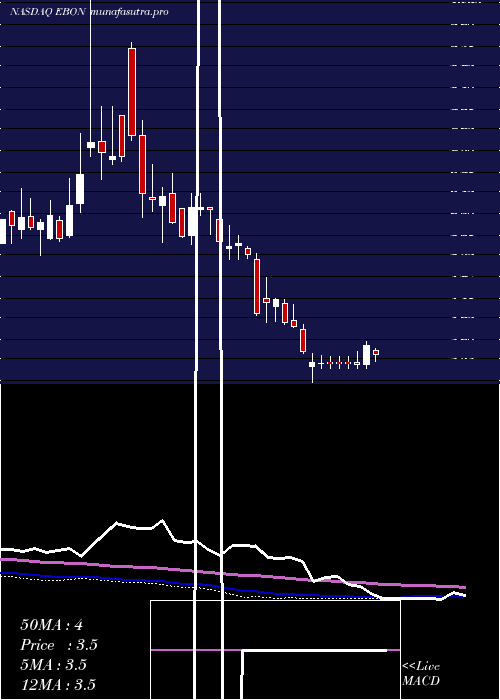
Weekly price and volumes for Ebang International
| Date |
Closing |
Open |
Range |
Volume |
Fri 11 July 2025 |
5.19 (53.55%) |
3.30 |
3.28 - 5.40 |
5.6141 times |
Thu 03 July 2025 |
3.38 (2.11%) |
3.31 |
3.17 - 3.50 |
1.134 times |
Fri 27 June 2025 |
3.31 (-8.06%) |
3.52 |
3.27 - 3.74 |
0.2478 times |
Fri 20 June 2025 |
3.60 (0%) |
3.59 |
3.28 - 3.80 |
0.212 times |
Fri 13 June 2025 |
3.60 (-1.64%) |
3.71 |
3.56 - 3.75 |
0.2239 times |
Fri 06 June 2025 |
3.66 (1.1%) |
3.84 |
3.50 - 3.84 |
0.2323 times |
Fri 30 May 2025 |
3.62 (-4.74%) |
3.94 |
3.61 - 3.94 |
0.2108 times |
Fri 23 May 2025 |
3.80 (-5%) |
4.03 |
3.53 - 4.16 |
0.9565 times |
Fri 16 May 2025 |
4.00 (3.63%) |
4.13 |
4.00 - 4.56 |
0.8362 times |
Fri 09 May 2025 |
3.86 (9.66%) |
3.41 |
3.41 - 3.98 |
0.3323 times |
Fri 02 May 2025 |
3.52 (-4.61%) |
3.60 |
3.40 - 3.64 |
0.2287 times |
Monthly price and charts EbangInternational Strong monthly Stock price targets for EbangInternational EBON are 4.18 and 6.41 | Monthly Target 1 | 2.36 | | Monthly Target 2 | 3.77 | | Monthly Target 3 | 4.5866666666667 | | Monthly Target 4 | 6 | | Monthly Target 5 | 6.82 |
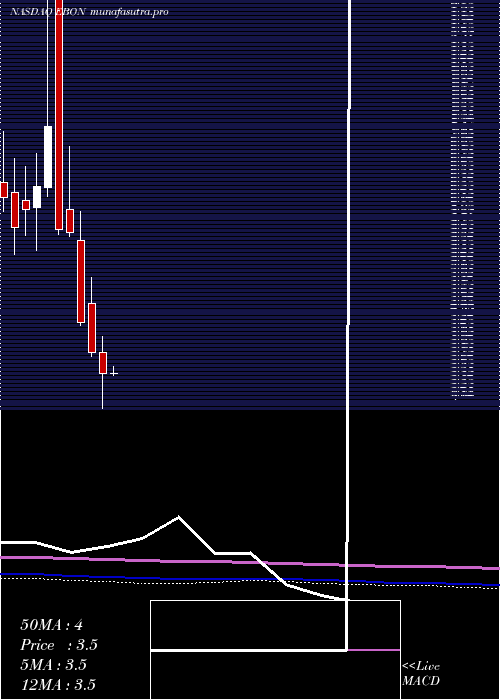
Monthly price and volumes Ebang International
| Date |
Closing |
Open |
Range |
Volume |
Fri 11 July 2025 |
5.19 (57.27%) |
3.45 |
3.17 - 5.40 |
1.1424 times |
Mon 30 June 2025 |
3.30 (-8.84%) |
3.84 |
3.27 - 3.84 |
0.1615 times |
Fri 30 May 2025 |
3.62 (2.26%) |
3.53 |
3.41 - 4.56 |
0.4122 times |
Wed 30 April 2025 |
3.54 (-8.05%) |
3.85 |
3.00 - 4.10 |
0.2357 times |
Mon 31 March 2025 |
3.85 (-10.67%) |
4.60 |
3.80 - 5.00 |
0.3496 times |
Fri 28 February 2025 |
4.31 (-24.12%) |
5.55 |
4.26 - 5.99 |
0.3469 times |
Fri 31 January 2025 |
5.68 (-0.7%) |
6.02 |
5.62 - 6.98 |
1.1475 times |
Tue 31 December 2024 |
5.72 (-21.54%) |
9.35 |
5.65 - 9.46 |
1.7383 times |
Tue 26 November 2024 |
7.29 (14.44%) |
6.35 |
6.22 - 10.94 |
3.2272 times |
Thu 31 October 2024 |
6.37 (5.81%) |
6.06 |
5.41 - 6.88 |
1.2386 times |
Mon 30 September 2024 |
6.02 (4.7%) |
6.16 |
5.63 - 6.68 |
0.4822 times |
DMA SMA EMA moving averages of Ebang International EBON
DMA (daily moving average) of Ebang International EBON
| DMA period | DMA value | | 5 day DMA | 4 | | 12 day DMA | 3.62 | | 20 day DMA | 3.61 | | 35 day DMA | 3.65 | | 50 day DMA | 3.71 | | 100 day DMA | 3.89 | | 150 day DMA | 4.71 | | 200 day DMA | 5.16 | EMA (exponential moving average) of Ebang International EBON
| EMA period | EMA current | EMA prev | EMA prev2 | | 5 day EMA | 4.27 | 3.81 | 3.38 | | 12 day EMA | 3.85 | 3.61 | 3.42 | | 20 day EMA | 3.74 | 3.59 | 3.48 | | 35 day EMA | 3.69 | 3.6 | 3.54 | | 50 day EMA | 3.73 | 3.67 | 3.63 |
SMA (simple moving average) of Ebang International EBON
| SMA period | SMA current | SMA prev | SMA prev2 | | 5 day SMA | 4 | 3.64 | 3.4 | | 12 day SMA | 3.62 | 3.48 | 3.38 | | 20 day SMA | 3.61 | 3.54 | 3.49 | | 35 day SMA | 3.65 | 3.62 | 3.6 | | 50 day SMA | 3.71 | 3.68 | 3.66 | | 100 day SMA | 3.89 | 3.89 | 3.9 | | 150 day SMA | 4.71 | 4.73 | 4.75 | | 200 day SMA | 5.16 | 5.16 | 5.17 |
|
|
