DigiInternational DGII full analysis,charts,indicators,moving averages,SMA,DMA,EMA,ADX,MACD,RSIDigi International DGII WideScreen charts, DMA,SMA,EMA technical analysis, forecast prediction, by indicators ADX,MACD,RSI,CCI NASDAQ stock exchange
operates under Technology sector & deals in Computer Communications Equipment
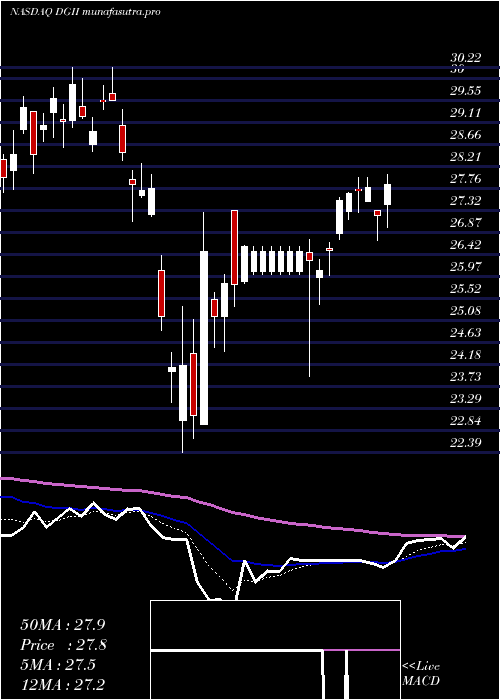
Daily price and charts and targets DigiInternational Strong Daily Stock price targets for DigiInternational DGII are 44.31 and 46.42 | Daily Target 1 | 42.64 | | Daily Target 2 | 43.87 | | Daily Target 3 | 44.753333333333 | | Daily Target 4 | 45.98 | | Daily Target 5 | 46.86 |
Daily price and volume Digi International
| Date |
Closing |
Open |
Range |
Volume |
Fri 05 December 2025 |
45.09 (3.16%) |
43.69 |
43.53 - 45.64 |
1.4756 times |
Thu 04 December 2025 |
43.71 (1.84%) |
42.83 |
42.57 - 43.72 |
1.0035 times |
Wed 03 December 2025 |
42.92 (1.11%) |
42.57 |
42.00 - 43.07 |
0.6356 times |
Tue 02 December 2025 |
42.45 (2.07%) |
41.70 |
41.56 - 42.63 |
0.7561 times |
Mon 01 December 2025 |
41.59 (-0.57%) |
41.65 |
40.64 - 41.88 |
0.9442 times |
Fri 28 November 2025 |
41.83 (-1.25%) |
42.29 |
40.65 - 42.61 |
0.3909 times |
Wed 26 November 2025 |
42.36 (1.24%) |
41.84 |
41.67 - 43.58 |
1.8728 times |
Tue 25 November 2025 |
41.84 (2.3%) |
40.83 |
40.53 - 42.15 |
0.821 times |
Mon 24 November 2025 |
40.90 (2.2%) |
40.00 |
38.16 - 40.92 |
1.0501 times |
Fri 21 November 2025 |
40.02 (4.74%) |
37.99 |
36.89 - 40.24 |
1.0504 times |
Thu 20 November 2025 |
38.21 (-4.02%) |
40.11 |
37.22 - 40.59 |
1.2671 times |
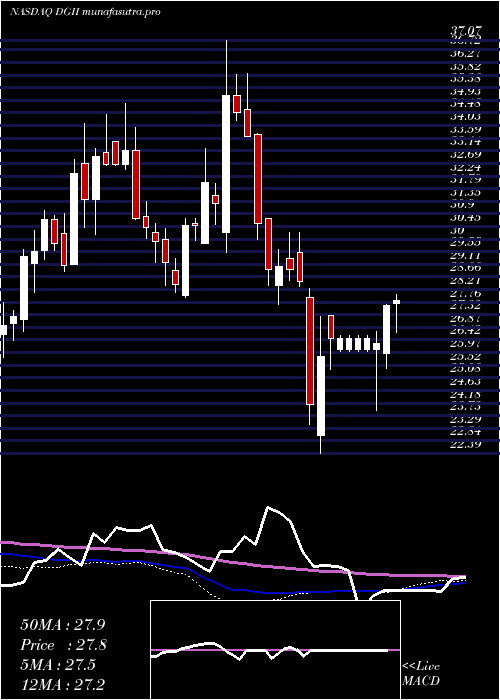
Weekly price and charts DigiInternational Strong weekly Stock price targets for DigiInternational DGII are 42.87 and 47.87 | Weekly Target 1 | 38.79 | | Weekly Target 2 | 41.94 | | Weekly Target 3 | 43.79 | | Weekly Target 4 | 46.94 | | Weekly Target 5 | 48.79 |
Weekly price and volumes for Digi International
| Date |
Closing |
Open |
Range |
Volume |
Fri 05 December 2025 |
45.09 (7.79%) |
41.65 |
40.64 - 45.64 |
1.7109 times |
Fri 28 November 2025 |
41.83 (4.52%) |
40.00 |
38.16 - 43.58 |
1.4692 times |
Fri 21 November 2025 |
40.02 (4.27%) |
38.38 |
36.89 - 40.59 |
1.8871 times |
Fri 14 November 2025 |
38.38 (8.42%) |
35.99 |
35.15 - 44.79 |
1.1942 times |
Fri 07 November 2025 |
35.40 (-3.49%) |
35.55 |
34.41 - 37.01 |
0.7254 times |
Fri 31 October 2025 |
36.68 (0%) |
37.89 |
36.57 - 38.23 |
0.2045 times |
Fri 31 October 2025 |
36.68 (-5.51%) |
38.97 |
36.57 - 39.36 |
0.8049 times |
Fri 24 October 2025 |
38.82 (2.4%) |
38.26 |
37.80 - 39.62 |
0.6515 times |
Fri 17 October 2025 |
37.91 (6.82%) |
36.02 |
35.69 - 38.43 |
0.753 times |
Tue 07 October 2025 |
35.49 (-2.55%) |
36.50 |
35.43 - 37.18 |
0.5992 times |
Fri 03 October 2025 |
36.42 (-2.07%) |
37.43 |
35.82 - 37.50 |
0.9234 times |
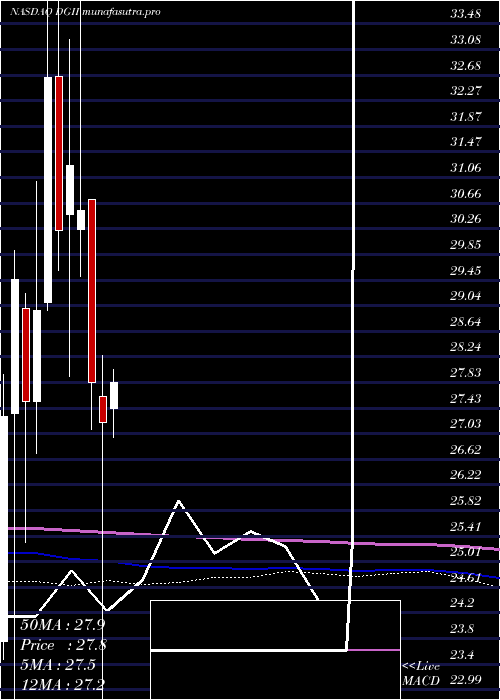
Monthly price and charts DigiInternational Strong monthly Stock price targets for DigiInternational DGII are 42.87 and 47.87 | Monthly Target 1 | 38.79 | | Monthly Target 2 | 41.94 | | Monthly Target 3 | 43.79 | | Monthly Target 4 | 46.94 | | Monthly Target 5 | 48.79 |
Monthly price and volumes Digi International
| Date |
Closing |
Open |
Range |
Volume |
Fri 05 December 2025 |
45.09 (7.79%) |
41.65 |
40.64 - 45.64 |
0.4014 times |
Fri 28 November 2025 |
41.83 (14.04%) |
35.55 |
34.41 - 44.79 |
1.2379 times |
Fri 31 October 2025 |
36.68 (0.6%) |
36.09 |
35.43 - 39.62 |
0.8249 times |
Tue 30 September 2025 |
36.46 (5.01%) |
34.02 |
33.41 - 38.64 |
1.2896 times |
Fri 29 August 2025 |
34.72 (6.47%) |
31.82 |
30.69 - 35.34 |
1.1847 times |
Thu 31 July 2025 |
32.61 (-6.45%) |
34.63 |
32.31 - 36.19 |
0.9194 times |
Mon 30 June 2025 |
34.86 (7.56%) |
32.27 |
31.76 - 35.44 |
0.7955 times |
Fri 30 May 2025 |
32.41 (19.15%) |
27.43 |
26.97 - 34.43 |
1.0443 times |
Wed 30 April 2025 |
27.20 (-2.26%) |
27.61 |
22.39 - 28.26 |
1.1777 times |
Mon 31 March 2025 |
27.83 (-8.87%) |
30.72 |
27.09 - 30.72 |
1.1245 times |
Fri 28 February 2025 |
30.54 (-2.27%) |
30.24 |
29.51 - 37.07 |
1.3917 times |
DMA SMA EMA moving averages of Digi International DGII
DMA (daily moving average) of Digi International DGII
| DMA period | DMA value | | 5 day DMA | 43.15 | | 12 day DMA | 41.73 | | 20 day DMA | 39.83 | | 35 day DMA | 38.94 | | 50 day DMA | 38.33 | | 100 day DMA | 36.16 | | 150 day DMA | 35.09 | | 200 day DMA | 33.39 | EMA (exponential moving average) of Digi International DGII
| EMA period | EMA current | EMA prev | EMA prev2 | | 5 day EMA | 43.47 | 42.66 | 42.13 | | 12 day EMA | 41.91 | 41.33 | 40.9 | | 20 day EMA | 40.77 | 40.32 | 39.96 | | 35 day EMA | 39.62 | 39.3 | 39.04 | | 50 day EMA | 38.71 | 38.45 | 38.24 |
SMA (simple moving average) of Digi International DGII
| SMA period | SMA current | SMA prev | SMA prev2 | | 5 day SMA | 43.15 | 42.5 | 42.23 | | 12 day SMA | 41.73 | 41.18 | 40.69 | | 20 day SMA | 39.83 | 39.35 | 38.98 | | 35 day SMA | 38.94 | 38.74 | 38.58 | | 50 day SMA | 38.33 | 38.17 | 38.05 | | 100 day SMA | 36.16 | 36.04 | 35.96 | | 150 day SMA | 35.09 | 34.97 | 34.87 | | 200 day SMA | 33.39 | 33.34 | 33.3 |
|
|
