CsgSystems CSGS full analysis,charts,indicators,moving averages,SMA,DMA,EMA,ADX,MACD,RSICsg Systems CSGS WideScreen charts, DMA,SMA,EMA technical analysis, forecast prediction, by indicators ADX,MACD,RSI,CCI NASDAQ stock exchange
operates under Technology sector & deals in EDP Services
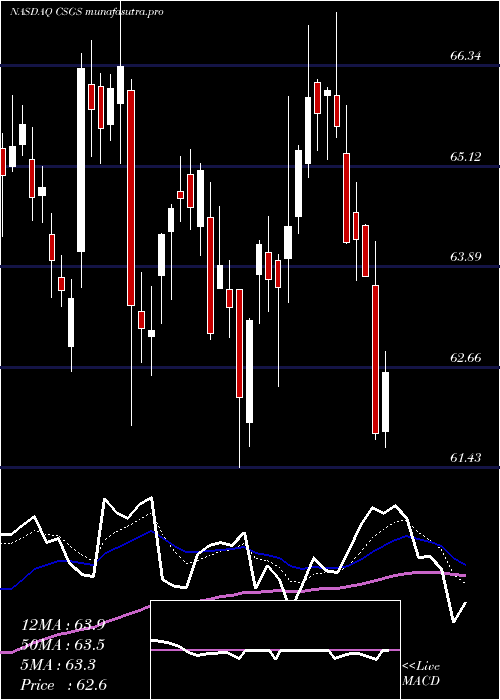
Daily price and charts and targets CsgSystems Strong Daily Stock price targets for CsgSystems CSGS are 76.85 and 77.17 | Daily Target 1 | 76.79 | | Daily Target 2 | 76.9 | | Daily Target 3 | 77.11 | | Daily Target 4 | 77.22 | | Daily Target 5 | 77.43 |
Daily price and volume Csg Systems
| Date |
Closing |
Open |
Range |
Volume |
Fri 05 December 2025 |
77.01 (-0.34%) |
77.20 |
77.00 - 77.32 |
0.8418 times |
Thu 04 December 2025 |
77.27 (-0.19%) |
77.39 |
76.72 - 77.39 |
0.7925 times |
Wed 03 December 2025 |
77.42 (-0.88%) |
78.00 |
77.41 - 78.03 |
0.7668 times |
Tue 02 December 2025 |
78.11 (-0.2%) |
78.40 |
78.02 - 78.40 |
0.6424 times |
Mon 01 December 2025 |
78.27 (-0.63%) |
78.49 |
78.24 - 78.55 |
0.7239 times |
Fri 28 November 2025 |
78.77 (0.34%) |
78.44 |
78.44 - 78.83 |
0.4066 times |
Wed 26 November 2025 |
78.50 (0.36%) |
78.44 |
78.28 - 78.82 |
0.9441 times |
Tue 25 November 2025 |
78.22 (0.51%) |
77.85 |
77.85 - 78.29 |
3.1269 times |
Mon 24 November 2025 |
77.82 (-0.03%) |
77.90 |
77.72 - 77.93 |
0.8244 times |
Fri 21 November 2025 |
77.84 (0.28%) |
77.76 |
77.63 - 78.01 |
0.9307 times |
Thu 20 November 2025 |
77.62 (-0.59%) |
78.53 |
77.60 - 78.53 |
0.8821 times |
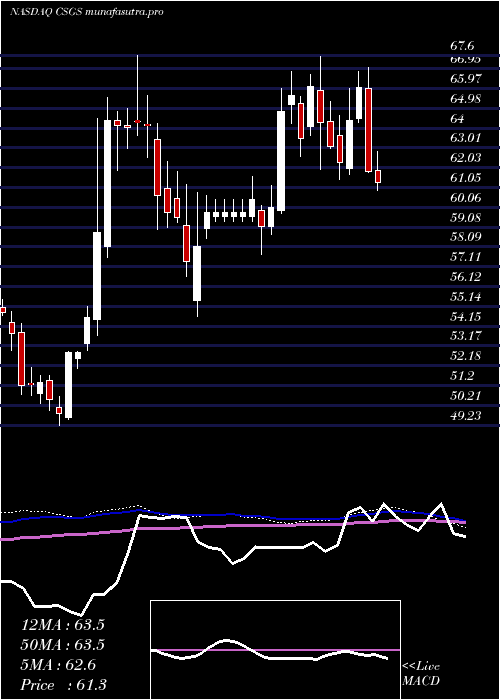
Weekly price and charts CsgSystems Strong weekly Stock price targets for CsgSystems CSGS are 75.95 and 77.78 | Weekly Target 1 | 75.6 | | Weekly Target 2 | 76.3 | | Weekly Target 3 | 77.426666666667 | | Weekly Target 4 | 78.13 | | Weekly Target 5 | 79.26 |
Weekly price and volumes for Csg Systems
| Date |
Closing |
Open |
Range |
Volume |
Fri 05 December 2025 |
77.01 (-2.23%) |
78.49 |
76.72 - 78.55 |
0.8908 times |
Fri 28 November 2025 |
78.77 (1.19%) |
77.90 |
77.72 - 78.83 |
1.2537 times |
Fri 21 November 2025 |
77.84 (-0.52%) |
78.27 |
77.60 - 78.53 |
0.8657 times |
Fri 14 November 2025 |
78.25 (-0.06%) |
78.42 |
78.07 - 78.88 |
1.296 times |
Fri 07 November 2025 |
78.30 (0.04%) |
78.30 |
78.04 - 78.80 |
1.4521 times |
Fri 31 October 2025 |
78.27 (0%) |
78.26 |
78.12 - 78.68 |
0.4317 times |
Fri 31 October 2025 |
78.27 (16.09%) |
67.50 |
66.92 - 79.20 |
2.6627 times |
Fri 24 October 2025 |
67.42 (4.12%) |
64.85 |
64.85 - 68.28 |
0.2698 times |
Fri 17 October 2025 |
64.75 (2.79%) |
63.46 |
62.91 - 66.01 |
0.4884 times |
Fri 10 October 2025 |
62.99 (-2.9%) |
64.87 |
62.84 - 65.04 |
0.3891 times |
Fri 03 October 2025 |
64.87 (-0.45%) |
65.34 |
63.51 - 65.66 |
0.3808 times |
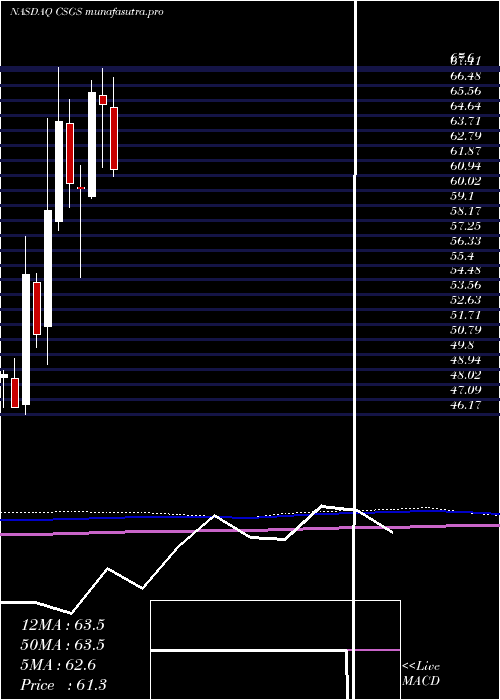
Monthly price and charts CsgSystems Strong monthly Stock price targets for CsgSystems CSGS are 75.95 and 77.78 | Monthly Target 1 | 75.6 | | Monthly Target 2 | 76.3 | | Monthly Target 3 | 77.426666666667 | | Monthly Target 4 | 78.13 | | Monthly Target 5 | 79.26 |
Monthly price and volumes Csg Systems
| Date |
Closing |
Open |
Range |
Volume |
Fri 05 December 2025 |
77.01 (-2.23%) |
78.49 |
76.72 - 78.55 |
0.3074 times |
Fri 28 November 2025 |
78.77 (0.64%) |
78.30 |
77.60 - 78.88 |
1.6797 times |
Fri 31 October 2025 |
78.27 (21.58%) |
63.95 |
62.84 - 79.20 |
1.5425 times |
Tue 30 September 2025 |
64.38 (0.34%) |
63.70 |
63.11 - 67.25 |
0.8383 times |
Fri 29 August 2025 |
64.16 (2.72%) |
61.90 |
60.54 - 65.25 |
0.9489 times |
Thu 31 July 2025 |
62.46 (-4.36%) |
65.14 |
60.87 - 66.99 |
0.8266 times |
Mon 30 June 2025 |
65.31 (-1.14%) |
65.88 |
61.43 - 67.58 |
0.8112 times |
Fri 30 May 2025 |
66.06 (9.86%) |
59.63 |
59.50 - 66.80 |
0.9832 times |
Wed 30 April 2025 |
60.13 (-0.56%) |
60.19 |
54.65 - 61.57 |
0.9721 times |
Mon 31 March 2025 |
60.47 (-5.96%) |
64.17 |
58.96 - 65.64 |
1.0901 times |
Fri 28 February 2025 |
64.30 (9.37%) |
58.09 |
57.55 - 67.60 |
1.098 times |
DMA SMA EMA moving averages of Csg Systems CSGS
DMA (daily moving average) of Csg Systems CSGS
| DMA period | DMA value | | 5 day DMA | 77.62 | | 12 day DMA | 77.91 | | 20 day DMA | 78.08 | | 35 day DMA | 75.52 | | 50 day DMA | 72.2 | | 100 day DMA | 67.91 | | 150 day DMA | 66.64 | | 200 day DMA | 65.17 | EMA (exponential moving average) of Csg Systems CSGS
| EMA period | EMA current | EMA prev | EMA prev2 | | 5 day EMA | 77.5 | 77.74 | 77.98 | | 12 day EMA | 77.71 | 77.84 | 77.94 | | 20 day EMA | 77.14 | 77.15 | 77.14 | | 35 day EMA | 74.77 | 74.64 | 74.49 | | 50 day EMA | 72.2 | 72 | 71.79 |
SMA (simple moving average) of Csg Systems CSGS
| SMA period | SMA current | SMA prev | SMA prev2 | | 5 day SMA | 77.62 | 77.97 | 78.21 | | 12 day SMA | 77.91 | 78.01 | 78.09 | | 20 day SMA | 78.08 | 78.13 | 78.18 | | 35 day SMA | 75.52 | 75.16 | 74.8 | | 50 day SMA | 72.2 | 71.96 | 71.72 | | 100 day SMA | 67.91 | 67.77 | 67.61 | | 150 day SMA | 66.64 | 66.53 | 66.41 | | 200 day SMA | 65.17 | 65.1 | 65.04 |
|
|
