CerenceInc CRNC full analysis,charts,indicators,moving averages,SMA,DMA,EMA,ADX,MACD,RSICerence Inc CRNC WideScreen charts, DMA,SMA,EMA technical analysis, forecast prediction, by indicators ADX,MACD,RSI,CCI NASDAQ stock exchange
Daily price and charts and targets CerenceInc Strong Daily Stock price targets for CerenceInc CRNC are 12.36 and 12.91 | Daily Target 1 | 12.26 | | Daily Target 2 | 12.45 | | Daily Target 3 | 12.81 | | Daily Target 4 | 13 | | Daily Target 5 | 13.36 |
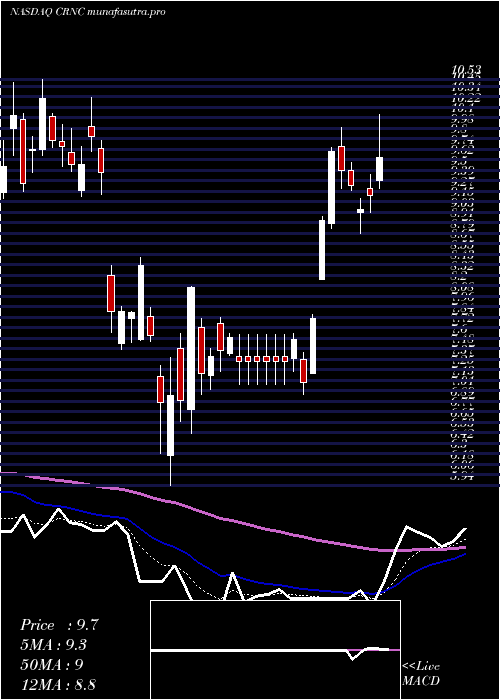
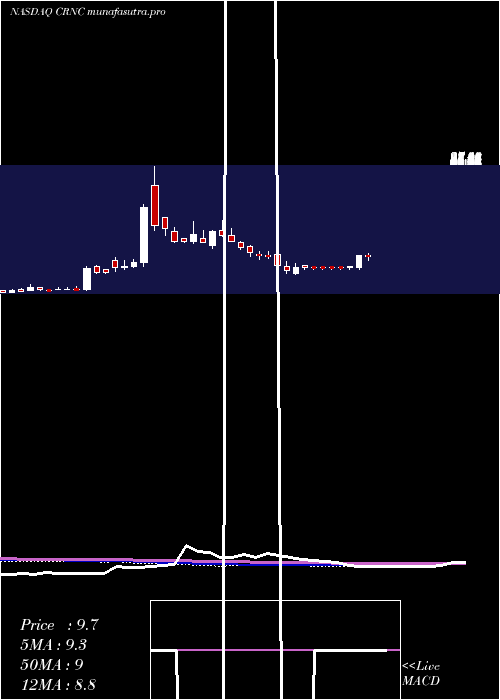
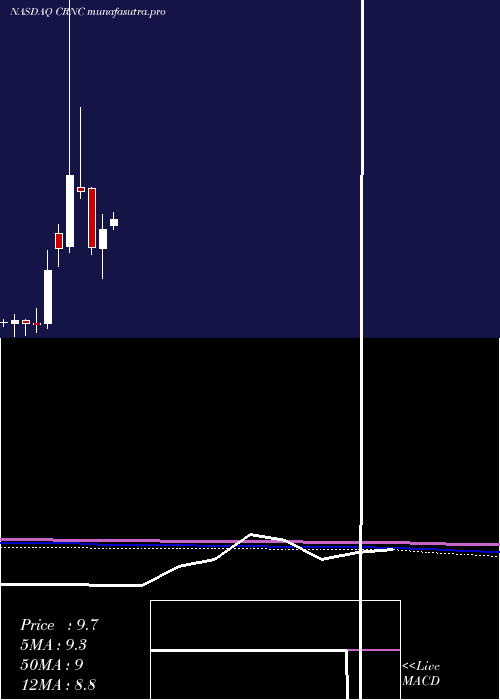
Daily price and volume Cerence Inc
| Date |
Closing |
Open |
Range |
Volume |
Fri 05 December 2025 |
12.64 (-2.54%) |
12.91 |
12.62 - 13.17 |
0.6306 times |
Thu 04 December 2025 |
12.97 (7.1%) |
11.89 |
11.89 - 12.99 |
0.9574 times |
Wed 03 December 2025 |
12.11 (9%) |
11.06 |
10.97 - 12.13 |
1.5835 times |
Tue 02 December 2025 |
11.11 (4.32%) |
10.78 |
10.66 - 11.18 |
0.6659 times |
Mon 01 December 2025 |
10.65 (-3.88%) |
10.71 |
10.50 - 10.89 |
0.7283 times |
Fri 28 November 2025 |
11.08 (5.93%) |
10.57 |
10.40 - 11.08 |
0.6075 times |
Wed 26 November 2025 |
10.46 (1.95%) |
10.32 |
10.27 - 10.64 |
0.5051 times |
Tue 25 November 2025 |
10.26 (-4.56%) |
10.75 |
10.09 - 10.75 |
0.8372 times |
Mon 24 November 2025 |
10.75 (3.86%) |
10.41 |
10.01 - 10.89 |
1.4994 times |
Fri 21 November 2025 |
10.35 (2.48%) |
9.91 |
9.56 - 10.82 |
1.9853 times |
Thu 20 November 2025 |
10.10 (27.53%) |
10.48 |
10.01 - 12.02 |
8.6278 times |
Weekly price and charts CerenceInc Strong weekly Stock price targets for CerenceInc CRNC are 11.57 and 14.24 | Weekly Target 1 | 9.43 | | Weekly Target 2 | 11.04 | | Weekly Target 3 | 12.103333333333 | | Weekly Target 4 | 13.71 | | Weekly Target 5 | 14.77 |
Weekly price and volumes for Cerence Inc
| Date |
Closing |
Open |
Range |
Volume |
Fri 05 December 2025 |
12.64 (14.08%) |
10.71 |
10.50 - 13.17 |
0.8257 times |
Fri 28 November 2025 |
11.08 (7.05%) |
10.41 |
10.01 - 11.08 |
0.6238 times |
Fri 21 November 2025 |
10.35 (23.8%) |
8.25 |
7.60 - 12.02 |
2.8516 times |
Fri 14 November 2025 |
8.36 (-9.72%) |
9.70 |
8.03 - 9.94 |
0.6761 times |
Fri 07 November 2025 |
9.26 (-13.7%) |
10.50 |
8.65 - 10.52 |
0.7344 times |
Fri 31 October 2025 |
10.73 (0%) |
10.97 |
10.73 - 11.16 |
0.127 times |
Fri 31 October 2025 |
10.73 (-7.18%) |
11.76 |
10.73 - 11.77 |
0.5069 times |
Fri 24 October 2025 |
11.56 (2.03%) |
11.97 |
10.84 - 12.15 |
0.7479 times |
Fri 17 October 2025 |
11.33 (7.09%) |
10.99 |
10.71 - 13.49 |
1.6247 times |
Fri 10 October 2025 |
10.58 (-16.82%) |
12.88 |
10.56 - 13.13 |
1.2818 times |
Fri 03 October 2025 |
12.72 (6.71%) |
12.18 |
11.80 - 13.74 |
1.4881 times |
Monthly price and charts CerenceInc Strong monthly Stock price targets for CerenceInc CRNC are 11.57 and 14.24 | Monthly Target 1 | 9.43 | | Monthly Target 2 | 11.04 | | Monthly Target 3 | 12.103333333333 | | Monthly Target 4 | 13.71 | | Monthly Target 5 | 14.77 |
Monthly price and volumes Cerence Inc
| Date |
Closing |
Open |
Range |
Volume |
Fri 05 December 2025 |
12.64 (14.08%) |
10.71 |
10.50 - 13.17 |
0.1906 times |
Fri 28 November 2025 |
11.08 (3.26%) |
10.50 |
7.60 - 12.02 |
1.1278 times |
Fri 31 October 2025 |
10.73 (-13.88%) |
12.43 |
10.56 - 13.74 |
1.1977 times |
Tue 30 September 2025 |
12.46 (18.33%) |
10.16 |
9.03 - 13.09 |
1.3128 times |
Fri 29 August 2025 |
10.53 (22.44%) |
8.30 |
8.04 - 13.54 |
1.7567 times |
Thu 31 July 2025 |
8.60 (-15.77%) |
10.15 |
8.35 - 11.92 |
1.2213 times |
Mon 30 June 2025 |
10.21 (19.98%) |
8.41 |
8.07 - 10.77 |
1.1444 times |
Fri 30 May 2025 |
8.51 (-6.07%) |
9.30 |
8.03 - 10.50 |
0.6835 times |
Wed 30 April 2025 |
9.06 (14.68%) |
7.83 |
5.94 - 9.99 |
0.5913 times |
Mon 31 March 2025 |
7.90 (-30.76%) |
11.60 |
7.47 - 11.71 |
0.7739 times |
Fri 28 February 2025 |
11.41 (-8.43%) |
11.68 |
11.01 - 16.74 |
1.6951 times |
DMA SMA EMA moving averages of Cerence Inc CRNC
DMA (daily moving average) of Cerence Inc CRNC
| DMA period | DMA value | | 5 day DMA | 11.9 | | 12 day DMA | 10.87 | | 20 day DMA | 10.02 | | 35 day DMA | 10.42 | | 50 day DMA | 10.93 | | 100 day DMA | 10.6 | | 150 day DMA | 10.19 | | 200 day DMA | 9.89 | EMA (exponential moving average) of Cerence Inc CRNC
| EMA period | EMA current | EMA prev | EMA prev2 | | 5 day EMA | 12.07 | 11.78 | 11.18 | | 12 day EMA | 11.16 | 10.89 | 10.51 | | 20 day EMA | 10.78 | 10.58 | 10.33 | | 35 day EMA | 10.79 | 10.68 | 10.55 | | 50 day EMA | 11.13 | 11.07 | 10.99 |
SMA (simple moving average) of Cerence Inc CRNC
| SMA period | SMA current | SMA prev | SMA prev2 | | 5 day SMA | 11.9 | 11.58 | 11.08 | | 12 day SMA | 10.87 | 10.47 | 10.04 | | 20 day SMA | 10.02 | 9.85 | 9.69 | | 35 day SMA | 10.42 | 10.39 | 10.36 | | 50 day SMA | 10.93 | 10.9 | 10.88 | | 100 day SMA | 10.6 | 10.56 | 10.52 | | 150 day SMA | 10.19 | 10.17 | 10.14 | | 200 day SMA | 9.89 | 9.89 | 9.89 |
|
|
