CraInternational CRAI full analysis,charts,indicators,moving averages,SMA,DMA,EMA,ADX,MACD,RSICra International CRAI WideScreen charts, DMA,SMA,EMA technical analysis, forecast prediction, by indicators ADX,MACD,RSI,CCI NASDAQ stock exchange
operates under Miscellaneous sector & deals in Other Consumer Services
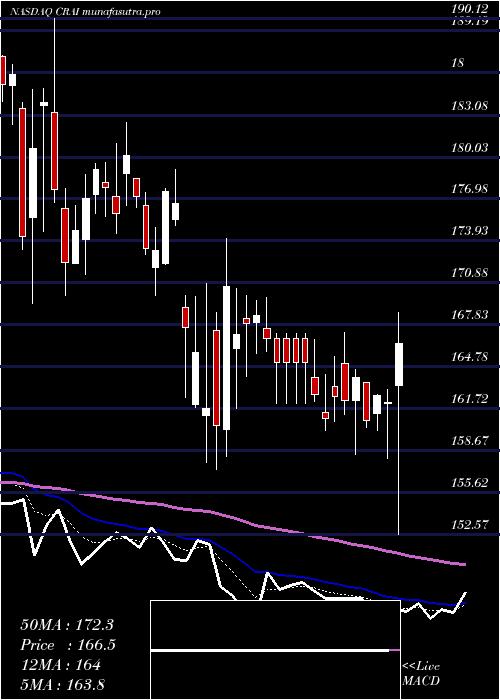
Daily price and charts and targets CraInternational Strong Daily Stock price targets for CraInternational CRAI are 187.35 and 192.89 | Daily Target 1 | 183 | | Daily Target 2 | 186.15 | | Daily Target 3 | 188.53666666667 | | Daily Target 4 | 191.69 | | Daily Target 5 | 194.08 |
Daily price and volume Cra International
| Date |
Closing |
Open |
Range |
Volume |
Fri 05 December 2025 |
189.31 (0.79%) |
186.83 |
185.38 - 190.92 |
0.8789 times |
Thu 04 December 2025 |
187.82 (0.62%) |
187.44 |
183.78 - 189.66 |
1.1074 times |
Wed 03 December 2025 |
186.66 (1.89%) |
182.69 |
178.78 - 189.61 |
1.4946 times |
Tue 02 December 2025 |
183.19 (2.6%) |
179.75 |
177.83 - 186.06 |
1.3049 times |
Mon 01 December 2025 |
178.55 (1.25%) |
175.68 |
175.15 - 180.26 |
0.737 times |
Fri 28 November 2025 |
176.34 (-0.58%) |
176.31 |
176.25 - 177.86 |
0.6363 times |
Wed 26 November 2025 |
177.36 (-0.05%) |
176.44 |
175.13 - 178.62 |
0.8854 times |
Tue 25 November 2025 |
177.44 (1.5%) |
173.29 |
173.29 - 178.74 |
0.9138 times |
Mon 24 November 2025 |
174.82 (-1.59%) |
176.96 |
173.65 - 178.00 |
0.7279 times |
Fri 21 November 2025 |
177.65 (2.26%) |
173.44 |
173.34 - 180.61 |
1.3139 times |
Thu 20 November 2025 |
173.72 (0.25%) |
176.31 |
172.29 - 176.64 |
1.1396 times |
Weekly price and charts CraInternational Strong weekly Stock price targets for CraInternational CRAI are 182.23 and 198 | Weekly Target 1 | 169.36 | | Weekly Target 2 | 179.33 | | Weekly Target 3 | 185.12666666667 | | Weekly Target 4 | 195.1 | | Weekly Target 5 | 200.9 |
Weekly price and volumes for Cra International
| Date |
Closing |
Open |
Range |
Volume |
Fri 05 December 2025 |
189.31 (7.36%) |
175.68 |
175.15 - 190.92 |
1.1301 times |
Fri 28 November 2025 |
176.34 (-0.74%) |
176.96 |
173.29 - 178.74 |
0.6473 times |
Fri 21 November 2025 |
177.65 (-1.83%) |
181.77 |
169.81 - 181.77 |
1.0997 times |
Fri 14 November 2025 |
180.96 (0.34%) |
180.65 |
177.94 - 187.09 |
1.05 times |
Fri 07 November 2025 |
180.35 (-5.32%) |
191.31 |
178.80 - 195.00 |
0.9402 times |
Fri 31 October 2025 |
190.49 (0%) |
185.44 |
182.52 - 191.57 |
0.3565 times |
Fri 31 October 2025 |
190.49 (1.18%) |
188.76 |
176.14 - 192.37 |
1.2014 times |
Fri 24 October 2025 |
188.26 (4.28%) |
182.68 |
180.01 - 190.94 |
0.6238 times |
Fri 17 October 2025 |
180.53 (2.02%) |
179.53 |
174.44 - 184.37 |
1.0316 times |
Fri 10 October 2025 |
176.95 (-9.65%) |
196.04 |
173.27 - 197.09 |
1.9195 times |
Fri 03 October 2025 |
195.84 (-4.55%) |
206.56 |
195.18 - 208.69 |
1.7452 times |
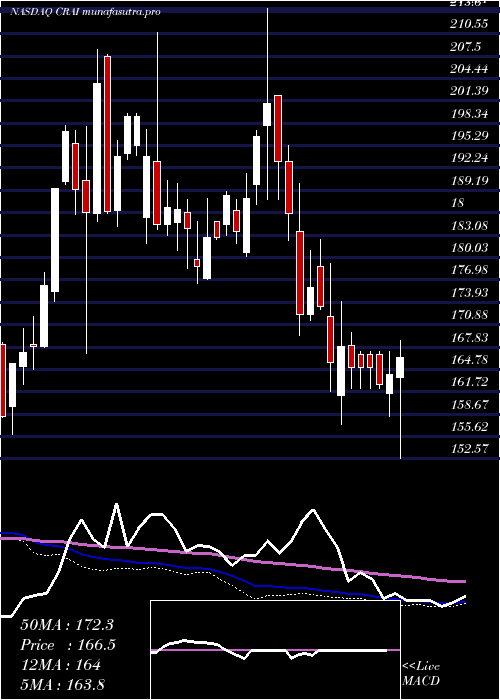
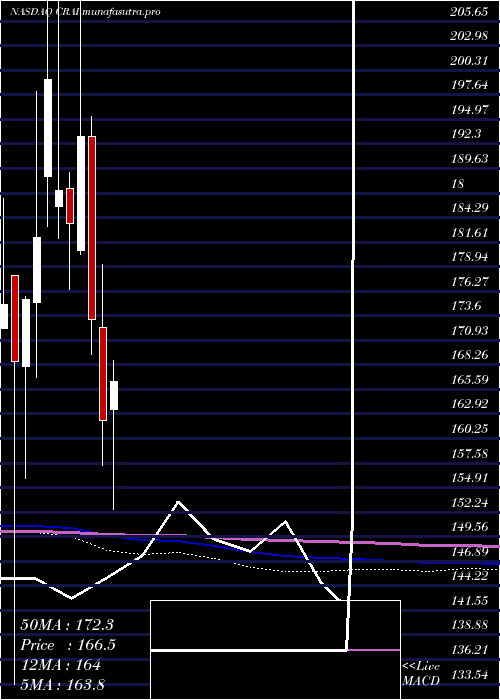
Monthly price and charts CraInternational Strong monthly Stock price targets for CraInternational CRAI are 182.23 and 198 | Monthly Target 1 | 169.36 | | Monthly Target 2 | 179.33 | | Monthly Target 3 | 185.12666666667 | | Monthly Target 4 | 195.1 | | Monthly Target 5 | 200.9 |
Monthly price and volumes Cra International
| Date |
Closing |
Open |
Range |
Volume |
Fri 05 December 2025 |
189.31 (7.36%) |
175.68 |
175.15 - 190.92 |
0.2546 times |
Fri 28 November 2025 |
176.34 (-7.43%) |
191.31 |
169.81 - 195.00 |
0.8419 times |
Fri 31 October 2025 |
190.49 (-8.65%) |
207.23 |
173.27 - 208.42 |
1.4107 times |
Tue 30 September 2025 |
208.53 (7.62%) |
191.71 |
190.56 - 214.66 |
1.1511 times |
Fri 29 August 2025 |
193.76 (9.68%) |
175.55 |
167.92 - 201.50 |
1.0699 times |
Thu 31 July 2025 |
176.66 (-5.72%) |
186.21 |
167.82 - 204.59 |
1.6129 times |
Mon 30 June 2025 |
187.37 (-1.41%) |
190.15 |
172.51 - 192.07 |
1.7371 times |
Fri 30 May 2025 |
190.05 (17.17%) |
163.40 |
152.57 - 196.13 |
0.8824 times |
Wed 30 April 2025 |
162.20 (-6.35%) |
172.32 |
157.34 - 179.15 |
0.5527 times |
Mon 31 March 2025 |
173.20 (-10.33%) |
193.15 |
169.38 - 195.31 |
0.4866 times |
Fri 28 February 2025 |
193.15 (5.21%) |
180.71 |
180.23 - 214.01 |
0.4742 times |
DMA SMA EMA moving averages of Cra International CRAI
DMA (daily moving average) of Cra International CRAI
| DMA period | DMA value | | 5 day DMA | 185.11 | | 12 day DMA | 179.68 | | 20 day DMA | 179.53 | | 35 day DMA | 182.16 | | 50 day DMA | 184.57 | | 100 day DMA | 187.81 | | 150 day DMA | 187.77 | | 200 day DMA | 184.73 | EMA (exponential moving average) of Cra International CRAI
| EMA period | EMA current | EMA prev | EMA prev2 | | 5 day EMA | 185.58 | 183.72 | 181.67 | | 12 day EMA | 182.24 | 180.95 | 179.7 | | 20 day EMA | 181.83 | 181.04 | 180.33 | | 35 day EMA | 183.58 | 183.24 | 182.97 | | 50 day EMA | 186.59 | 186.48 | 186.43 |
SMA (simple moving average) of Cra International CRAI
| SMA period | SMA current | SMA prev | SMA prev2 | | 5 day SMA | 185.11 | 182.51 | 180.42 | | 12 day SMA | 179.68 | 178.21 | 176.96 | | 20 day SMA | 179.53 | 179.22 | 179.32 | | 35 day SMA | 182.16 | 181.94 | 181.68 | | 50 day SMA | 184.57 | 184.91 | 185.3 | | 100 day SMA | 187.81 | 187.72 | 187.73 | | 150 day SMA | 187.77 | 187.61 | 187.44 | | 200 day SMA | 184.73 | 184.73 | 184.74 |
|
|
