ConduentInc CNDT full analysis,charts,indicators,moving averages,SMA,DMA,EMA,ADX,MACD,RSIConduent Inc CNDT WideScreen charts, DMA,SMA,EMA technical analysis, forecast prediction, by indicators ADX,MACD,RSI,CCI NASDAQ stock exchange
Daily price and charts and targets ConduentInc Strong Daily Stock price targets for ConduentInc CNDT are 1.91 and 1.98 | Daily Target 1 | 1.89 | | Daily Target 2 | 1.92 | | Daily Target 3 | 1.96 | | Daily Target 4 | 1.99 | | Daily Target 5 | 2.03 |
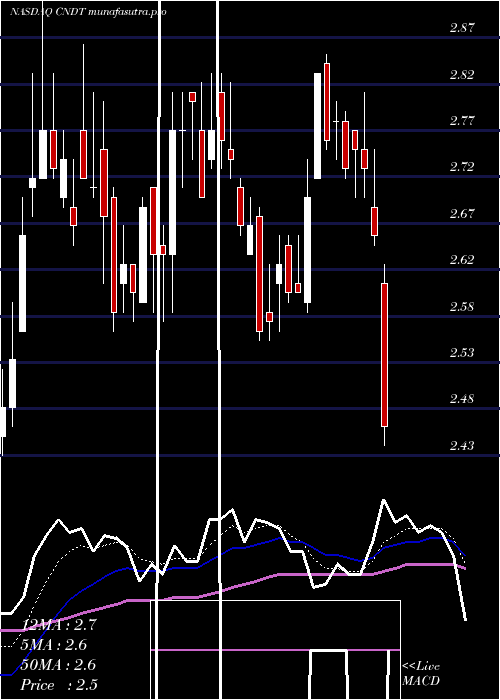
Daily price and volume Conduent Inc
| Date |
Closing |
Open |
Range |
Volume |
Fri 05 December 2025 |
1.95 (-1.52%) |
1.98 |
1.93 - 2.00 |
1.2232 times |
Thu 04 December 2025 |
1.98 (-1%) |
1.98 |
1.98 - 2.07 |
1.0275 times |
Wed 03 December 2025 |
2.00 (6.38%) |
1.88 |
1.87 - 2.03 |
1.2522 times |
Tue 02 December 2025 |
1.88 (-6.47%) |
2.00 |
1.88 - 2.03 |
0.5929 times |
Mon 01 December 2025 |
2.01 (3.61%) |
1.91 |
1.89 - 2.02 |
1.2116 times |
Fri 28 November 2025 |
1.94 (1.04%) |
1.94 |
1.89 - 1.94 |
0.3677 times |
Wed 26 November 2025 |
1.92 (1.05%) |
1.87 |
1.86 - 1.94 |
0.8049 times |
Tue 25 November 2025 |
1.90 (4.4%) |
1.82 |
1.81 - 1.91 |
1.1483 times |
Mon 24 November 2025 |
1.82 (-2.15%) |
1.87 |
1.80 - 1.90 |
0.995 times |
Fri 21 November 2025 |
1.86 (3.91%) |
1.79 |
1.79 - 1.91 |
1.3767 times |
Thu 20 November 2025 |
1.79 (-4.28%) |
1.91 |
1.76 - 1.94 |
1.5476 times |
Weekly price and charts ConduentInc Strong weekly Stock price targets for ConduentInc CNDT are 1.91 and 2.11 | Weekly Target 1 | 1.76 | | Weekly Target 2 | 1.86 | | Weekly Target 3 | 1.9633333333333 | | Weekly Target 4 | 2.06 | | Weekly Target 5 | 2.16 |
Weekly price and volumes for Conduent Inc
| Date |
Closing |
Open |
Range |
Volume |
Fri 05 December 2025 |
1.95 (0.52%) |
1.91 |
1.87 - 2.07 |
1.0403 times |
Fri 28 November 2025 |
1.94 (4.3%) |
1.87 |
1.80 - 1.94 |
0.6499 times |
Fri 21 November 2025 |
1.86 (-9.27%) |
2.03 |
1.76 - 2.03 |
1.4357 times |
Fri 14 November 2025 |
2.05 (15.82%) |
1.82 |
1.73 - 2.08 |
1.6061 times |
Fri 07 November 2025 |
1.77 (-25.63%) |
2.31 |
1.72 - 2.36 |
1.1394 times |
Fri 31 October 2025 |
2.38 (0%) |
2.38 |
2.31 - 2.41 |
0.2046 times |
Fri 31 October 2025 |
2.38 (-8.46%) |
2.61 |
2.31 - 2.63 |
1.2702 times |
Fri 24 October 2025 |
2.60 (7%) |
2.47 |
2.46 - 2.66 |
0.6492 times |
Fri 17 October 2025 |
2.43 (-2.02%) |
2.53 |
2.36 - 2.55 |
1.1418 times |
Fri 10 October 2025 |
2.48 (-9.82%) |
2.76 |
2.47 - 2.80 |
0.8628 times |
Fri 03 October 2025 |
2.75 (-3.17%) |
2.85 |
2.71 - 2.85 |
0.6218 times |

Monthly price and charts ConduentInc Strong monthly Stock price targets for ConduentInc CNDT are 1.91 and 2.11 | Monthly Target 1 | 1.76 | | Monthly Target 2 | 1.86 | | Monthly Target 3 | 1.9633333333333 | | Monthly Target 4 | 2.06 | | Monthly Target 5 | 2.16 |
Monthly price and volumes Conduent Inc
| Date |
Closing |
Open |
Range |
Volume |
Fri 05 December 2025 |
1.95 (0.52%) |
1.91 |
1.87 - 2.07 |
0.2538 times |
Fri 28 November 2025 |
1.94 (-18.49%) |
2.31 |
1.72 - 2.36 |
1.1789 times |
Fri 31 October 2025 |
2.38 (-15%) |
2.76 |
2.31 - 2.83 |
1.0991 times |
Tue 30 September 2025 |
2.80 (0.72%) |
2.72 |
2.64 - 2.98 |
0.8402 times |
Fri 29 August 2025 |
2.78 (4.51%) |
2.61 |
2.34 - 2.94 |
0.994 times |
Thu 31 July 2025 |
2.66 (0.76%) |
2.64 |
2.55 - 2.85 |
0.8005 times |
Mon 30 June 2025 |
2.64 (17.86%) |
2.24 |
2.22 - 2.93 |
1.2763 times |
Fri 30 May 2025 |
2.24 (6.16%) |
2.12 |
1.90 - 2.42 |
1.4041 times |
Wed 30 April 2025 |
2.11 (-21.85%) |
2.70 |
1.93 - 2.76 |
1.2371 times |
Mon 31 March 2025 |
2.70 (-23.73%) |
3.54 |
2.70 - 3.57 |
0.916 times |
Fri 28 February 2025 |
3.54 (-10.61%) |
3.89 |
3.50 - 4.90 |
0.8907 times |

DMA SMA EMA moving averages of Conduent Inc CNDT
DMA (daily moving average) of Conduent Inc CNDT
| DMA period | DMA value | | 5 day DMA | 1.96 | | 12 day DMA | 1.91 | | 20 day DMA | 1.92 | | 35 day DMA | 2.14 | | 50 day DMA | 2.3 | | 100 day DMA | 2.5 | | 150 day DMA | 2.49 | | 200 day DMA | 2.55 | EMA (exponential moving average) of Conduent Inc CNDT
| EMA period | EMA current | EMA prev | EMA prev2 | | 5 day EMA | 1.96 | 1.96 | 1.95 | | 12 day EMA | 1.95 | 1.95 | 1.94 | | 20 day EMA | 2 | 2.01 | 2.01 | | 35 day EMA | 2.13 | 2.14 | 2.15 | | 50 day EMA | 2.32 | 2.33 | 2.34 |
SMA (simple moving average) of Conduent Inc CNDT
| SMA period | SMA current | SMA prev | SMA prev2 | | 5 day SMA | 1.96 | 1.96 | 1.95 | | 12 day SMA | 1.91 | 1.91 | 1.91 | | 20 day SMA | 1.92 | 1.93 | 1.95 | | 35 day SMA | 2.14 | 2.16 | 2.17 | | 50 day SMA | 2.3 | 2.31 | 2.33 | | 100 day SMA | 2.5 | 2.51 | 2.51 | | 150 day SMA | 2.49 | 2.49 | 2.5 | | 200 day SMA | 2.55 | 2.56 | 2.57 |
|
|
