ComcastCorporation CMCSA full analysis,charts,indicators,moving averages,SMA,DMA,EMA,ADX,MACD,RSIComcast Corporation CMCSA WideScreen charts, DMA,SMA,EMA technical analysis, forecast prediction, by indicators ADX,MACD,RSI,CCI NASDAQ stock exchange
operates under Consumer Services sector & deals in Television Services
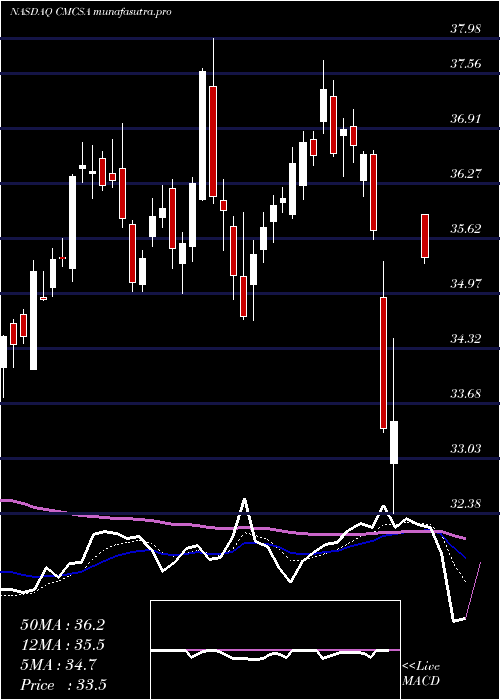
Daily price and charts and targets ComcastCorporation Strong Daily Stock price targets for ComcastCorporation CMCSA are 29.05 and 29.5 | Daily Target 1 | 28.96 | | Daily Target 2 | 29.13 | | Daily Target 3 | 29.413333333333 | | Daily Target 4 | 29.58 | | Daily Target 5 | 29.86 |
Daily price and volume Comcast Corporation
| Date |
Closing |
Open |
Range |
Volume |
Thu 23 October 2025 |
29.29 (-0.41%) |
29.54 |
29.25 - 29.70 |
0.6609 times |
Wed 22 October 2025 |
29.41 (-1.87%) |
30.06 |
29.38 - 30.09 |
0.8314 times |
Tue 21 October 2025 |
29.97 (1.35%) |
29.65 |
29.49 - 29.99 |
1.5909 times |
Mon 20 October 2025 |
29.57 (0.07%) |
29.68 |
29.32 - 29.68 |
0.5576 times |
Fri 17 October 2025 |
29.55 (1.13%) |
29.23 |
29.16 - 29.64 |
0.9655 times |
Thu 16 October 2025 |
29.22 (-1.68%) |
29.78 |
29.15 - 29.86 |
0.9686 times |
Wed 15 October 2025 |
29.72 (-0.9%) |
29.93 |
29.45 - 30.12 |
1.0861 times |
Tue 14 October 2025 |
29.99 (1.97%) |
29.42 |
29.41 - 30.11 |
1.2374 times |
Mon 13 October 2025 |
29.41 (-0.17%) |
29.53 |
29.39 - 29.77 |
0.8908 times |
Fri 10 October 2025 |
29.46 (-2.06%) |
30.19 |
29.43 - 30.38 |
1.2109 times |
Thu 09 October 2025 |
30.08 (-2.24%) |
30.86 |
30.06 - 30.97 |
1.1928 times |
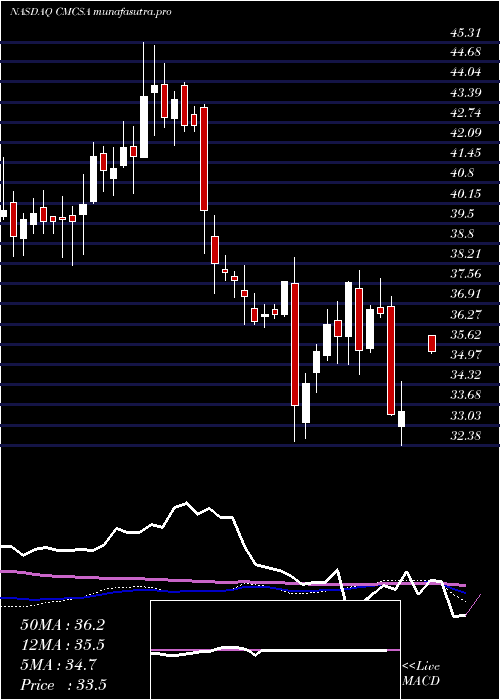
Weekly price and charts ComcastCorporation Strong weekly Stock price targets for ComcastCorporation CMCSA are 28.85 and 29.69 | Weekly Target 1 | 28.7 | | Weekly Target 2 | 29 | | Weekly Target 3 | 29.543333333333 | | Weekly Target 4 | 29.84 | | Weekly Target 5 | 30.38 |
Weekly price and volumes for Comcast Corporation
| Date |
Closing |
Open |
Range |
Volume |
Thu 23 October 2025 |
29.29 (-0.88%) |
29.68 |
29.25 - 30.09 |
0.6825 times |
Fri 17 October 2025 |
29.55 (0.31%) |
29.53 |
29.15 - 30.12 |
0.9651 times |
Fri 10 October 2025 |
29.46 (-4.78%) |
30.87 |
29.43 - 31.13 |
1.2141 times |
Fri 03 October 2025 |
30.94 (-2.46%) |
31.83 |
30.35 - 31.87 |
1.3901 times |
Fri 26 September 2025 |
31.72 (0.41%) |
31.33 |
31.30 - 32.18 |
1.1949 times |
Fri 19 September 2025 |
31.59 (-4.45%) |
33.03 |
31.33 - 33.15 |
1.5068 times |
Fri 12 September 2025 |
33.06 (-2.51%) |
32.57 |
32.45 - 34.11 |
1.0733 times |
Fri 05 September 2025 |
33.91 (-0.18%) |
33.70 |
33.48 - 34.45 |
0.8651 times |
Fri 29 August 2025 |
33.97 (0%) |
33.56 |
33.46 - 33.99 |
0.1658 times |
Fri 29 August 2025 |
33.97 (-0.53%) |
34.05 |
33.26 - 34.18 |
0.9423 times |
Fri 22 August 2025 |
34.15 (2.09%) |
33.25 |
33.06 - 34.40 |
1.0274 times |
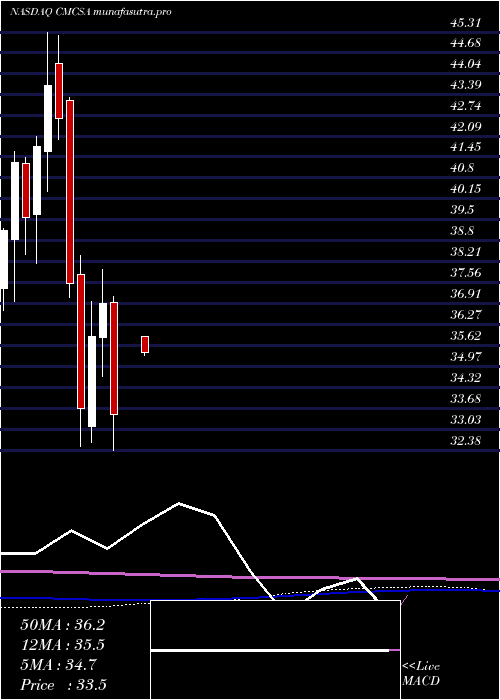
Monthly price and charts ComcastCorporation Strong monthly Stock price targets for ComcastCorporation CMCSA are 28.11 and 30.33 | Monthly Target 1 | 27.72 | | Monthly Target 2 | 28.5 | | Monthly Target 3 | 29.936666666667 | | Monthly Target 4 | 30.72 | | Monthly Target 5 | 32.16 |
Monthly price and volumes Comcast Corporation
| Date |
Closing |
Open |
Range |
Volume |
Thu 23 October 2025 |
29.29 (-6.78%) |
31.04 |
29.15 - 31.37 |
0.7672 times |
Tue 30 September 2025 |
31.42 (-7.51%) |
33.70 |
31.23 - 34.45 |
1.0984 times |
Fri 29 August 2025 |
33.97 (2.23%) |
33.35 |
31.03 - 34.40 |
0.9009 times |
Thu 31 July 2025 |
33.23 (-6.89%) |
35.59 |
32.39 - 36.66 |
0.9254 times |
Mon 30 June 2025 |
35.69 (3.24%) |
34.32 |
33.83 - 35.77 |
0.8282 times |
Fri 30 May 2025 |
34.57 (1.08%) |
33.85 |
33.68 - 35.78 |
0.8904 times |
Wed 30 April 2025 |
34.20 (-7.32%) |
36.94 |
31.44 - 37.14 |
1.1782 times |
Mon 31 March 2025 |
36.90 (2.84%) |
35.87 |
34.65 - 37.98 |
1.1342 times |
Fri 28 February 2025 |
35.88 (6.6%) |
33.11 |
32.61 - 36.98 |
1.1076 times |
Fri 31 January 2025 |
33.66 (-10.31%) |
37.80 |
32.50 - 38.40 |
1.1695 times |
Tue 31 December 2024 |
37.53 (-11.98%) |
43.21 |
37.11 - 43.30 |
0.7589 times |
DMA SMA EMA moving averages of Comcast Corporation CMCSA
DMA (daily moving average) of Comcast Corporation CMCSA
| DMA period | DMA value | | 5 day DMA | 29.56 | | 12 day DMA | 29.7 | | 20 day DMA | 30.25 | | 35 day DMA | 31.24 | | 50 day DMA | 32 | | 100 day DMA | 33.19 | | 150 day DMA | 33.65 | | 200 day DMA | 34.2 | EMA (exponential moving average) of Comcast Corporation CMCSA
| EMA period | EMA current | EMA prev | EMA prev2 | | 5 day EMA | 29.51 | 29.62 | 29.72 | | 12 day EMA | 29.81 | 29.91 | 30 | | 20 day EMA | 30.23 | 30.33 | 30.43 | | 35 day EMA | 30.99 | 31.09 | 31.19 | | 50 day EMA | 31.78 | 31.88 | 31.98 |
SMA (simple moving average) of Comcast Corporation CMCSA
| SMA period | SMA current | SMA prev | SMA prev2 | | 5 day SMA | 29.56 | 29.54 | 29.61 | | 12 day SMA | 29.7 | 29.81 | 29.95 | | 20 day SMA | 30.25 | 30.37 | 30.48 | | 35 day SMA | 31.24 | 31.37 | 31.5 | | 50 day SMA | 32 | 32.08 | 32.15 | | 100 day SMA | 33.19 | 33.24 | 33.29 | | 150 day SMA | 33.65 | 33.7 | 33.75 | | 200 day SMA | 34.2 | 34.24 | 34.28 |
|
|
