CleansparkInc CLSK full analysis,charts,indicators,moving averages,SMA,DMA,EMA,ADX,MACD,RSICleanspark Inc CLSK WideScreen charts, DMA,SMA,EMA technical analysis, forecast prediction, by indicators ADX,MACD,RSI,CCI NASDAQ stock exchange
Daily price and charts and targets CleansparkInc Strong Daily Stock price targets for CleansparkInc CLSK are 14.52 and 15.76 | Daily Target 1 | 13.53 | | Daily Target 2 | 14.27 | | Daily Target 3 | 14.766666666667 | | Daily Target 4 | 15.51 | | Daily Target 5 | 16.01 |
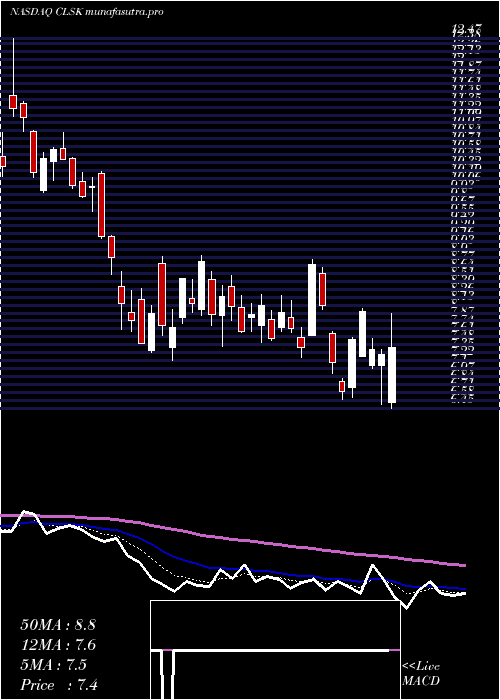
Daily price and volume Cleanspark Inc
| Date |
Closing |
Open |
Range |
Volume |
Thu 04 December 2025 |
15.02 (3.66%) |
14.56 |
14.02 - 15.26 |
0.7129 times |
Wed 03 December 2025 |
14.49 (5.77%) |
13.96 |
13.51 - 14.67 |
0.9462 times |
Tue 02 December 2025 |
13.70 (-2.7%) |
14.15 |
13.68 - 14.99 |
0.9044 times |
Mon 01 December 2025 |
14.08 (-6.75%) |
14.18 |
13.94 - 15.04 |
1.3086 times |
Fri 28 November 2025 |
15.10 (12.27%) |
14.24 |
14.01 - 15.54 |
1.3691 times |
Wed 26 November 2025 |
13.45 (13.5%) |
11.61 |
11.35 - 13.58 |
1.5597 times |
Tue 25 November 2025 |
11.85 (3.4%) |
11.46 |
10.79 - 11.92 |
0.8415 times |
Mon 24 November 2025 |
11.46 (17.78%) |
10.05 |
10.02 - 11.62 |
0.8003 times |
Fri 21 November 2025 |
9.73 (-0.51%) |
9.81 |
9.06 - 9.93 |
0.7538 times |
Thu 20 November 2025 |
9.78 (-4.31%) |
10.75 |
9.74 - 11.18 |
0.8035 times |
Wed 19 November 2025 |
10.22 (-5.28%) |
10.73 |
10.05 - 11.05 |
0.7265 times |
Weekly price and charts CleansparkInc Strong weekly Stock price targets for CleansparkInc CLSK are 14.27 and 16.02 | Weekly Target 1 | 12.85 | | Weekly Target 2 | 13.93 | | Weekly Target 3 | 14.596666666667 | | Weekly Target 4 | 15.68 | | Weekly Target 5 | 16.35 |
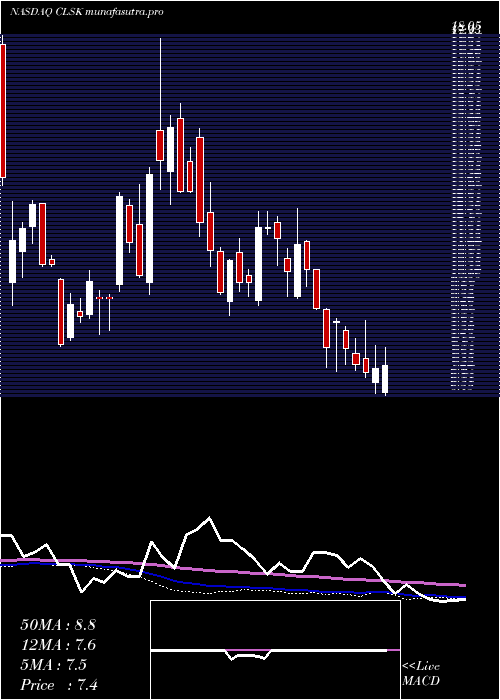
Weekly price and volumes for Cleanspark Inc
| Date |
Closing |
Open |
Range |
Volume |
Thu 04 December 2025 |
15.02 (-0.53%) |
14.18 |
13.51 - 15.26 |
0.9879 times |
Fri 28 November 2025 |
15.10 (55.19%) |
10.05 |
10.02 - 15.54 |
1.1661 times |
Fri 21 November 2025 |
9.73 (-11.22%) |
10.71 |
9.06 - 11.18 |
0.9155 times |
Fri 14 November 2025 |
10.96 (-29.7%) |
16.45 |
10.91 - 16.52 |
1.4 times |
Fri 07 November 2025 |
15.59 (-12.42%) |
16.48 |
14.06 - 17.73 |
0.5821 times |
Fri 31 October 2025 |
17.80 (0%) |
18.20 |
17.38 - 18.38 |
0.1221 times |
Fri 31 October 2025 |
17.80 (-8.11%) |
20.04 |
17.38 - 20.87 |
0.8124 times |
Fri 24 October 2025 |
19.37 (-2.42%) |
20.44 |
16.23 - 22.69 |
1.009 times |
Fri 17 October 2025 |
19.85 (2.96%) |
20.23 |
17.12 - 23.61 |
1.3812 times |
Fri 10 October 2025 |
19.28 (21.11%) |
16.45 |
16.23 - 22.12 |
1.6238 times |
Fri 03 October 2025 |
15.92 (22.84%) |
13.31 |
13.30 - 16.55 |
1.116 times |
Monthly price and charts CleansparkInc Strong monthly Stock price targets for CleansparkInc CLSK are 14.27 and 16.02 | Monthly Target 1 | 12.85 | | Monthly Target 2 | 13.93 | | Monthly Target 3 | 14.596666666667 | | Monthly Target 4 | 15.68 | | Monthly Target 5 | 16.35 |
Monthly price and volumes Cleanspark Inc
| Date |
Closing |
Open |
Range |
Volume |
Thu 04 December 2025 |
15.02 (-0.53%) |
14.18 |
13.51 - 15.26 |
0.2746 times |
Fri 28 November 2025 |
15.10 (-15.17%) |
16.48 |
9.06 - 17.73 |
1.1297 times |
Fri 31 October 2025 |
17.80 (22.76%) |
15.08 |
14.25 - 23.61 |
1.5596 times |
Tue 30 September 2025 |
14.50 (53.12%) |
9.27 |
8.88 - 15.19 |
1.1936 times |
Fri 29 August 2025 |
9.47 (-16.71%) |
10.80 |
8.97 - 11.44 |
0.7592 times |
Thu 31 July 2025 |
11.37 (3.08%) |
10.79 |
10.60 - 13.66 |
1.0565 times |
Mon 30 June 2025 |
11.03 (27.81%) |
8.57 |
8.40 - 11.13 |
1.0041 times |
Fri 30 May 2025 |
8.63 (5.63%) |
8.63 |
7.82 - 11.04 |
1.1159 times |
Wed 30 April 2025 |
8.17 (21.58%) |
6.78 |
6.45 - 9.28 |
0.9219 times |
Mon 31 March 2025 |
6.72 (-15.89%) |
8.81 |
6.59 - 8.93 |
0.985 times |
Fri 28 February 2025 |
7.99 (-23.47%) |
9.63 |
7.36 - 12.47 |
0.8375 times |

DMA SMA EMA moving averages of Cleanspark Inc CLSK
DMA (daily moving average) of Cleanspark Inc CLSK
| DMA period | DMA value | | 5 day DMA | 14.48 | | 12 day DMA | 12.47 | | 20 day DMA | 12.83 | | 35 day DMA | 15.23 | | 50 day DMA | 15.88 | | 100 day DMA | 13.37 | | 150 day DMA | 12.24 | | 200 day DMA | 11.16 | EMA (exponential moving average) of Cleanspark Inc CLSK
| EMA period | EMA current | EMA prev | EMA prev2 | | 5 day EMA | 14.21 | 13.8 | 13.45 | | 12 day EMA | 13.51 | 13.23 | 13 | | 20 day EMA | 13.68 | 13.54 | 13.44 | | 35 day EMA | 14.32 | 14.28 | 14.27 | | 50 day EMA | 15.57 | 15.59 | 15.63 |
SMA (simple moving average) of Cleanspark Inc CLSK
| SMA period | SMA current | SMA prev | SMA prev2 | | 5 day SMA | 14.48 | 14.16 | 13.64 | | 12 day SMA | 12.47 | 12.11 | 11.81 | | 20 day SMA | 12.83 | 12.91 | 13 | | 35 day SMA | 15.23 | 15.46 | 15.67 | | 50 day SMA | 15.88 | 15.86 | 15.85 | | 100 day SMA | 13.37 | 13.34 | 13.32 | | 150 day SMA | 12.24 | 12.2 | 12.16 | | 200 day SMA | 11.16 | 11.13 | 11.11 |
|
|
