ClearfieldInc CLFD full analysis,charts,indicators,moving averages,SMA,DMA,EMA,ADX,MACD,RSIClearfield Inc CLFD WideScreen charts, DMA,SMA,EMA technical analysis, forecast prediction, by indicators ADX,MACD,RSI,CCI NASDAQ stock exchange
operates under Public Utilities sector & deals in Telecommunications Equipment
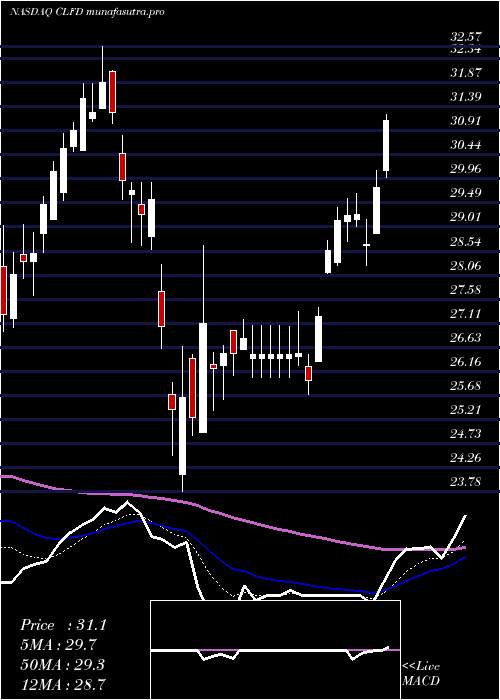
Daily price and charts and targets ClearfieldInc Strong Daily Stock price targets for ClearfieldInc CLFD are 28.21 and 29.06 | Daily Target 1 | 28.03 | | Daily Target 2 | 28.38 | | Daily Target 3 | 28.876666666667 | | Daily Target 4 | 29.23 | | Daily Target 5 | 29.73 |
Daily price and volume Clearfield Inc
| Date |
Closing |
Open |
Range |
Volume |
Fri 05 December 2025 |
28.74 (-0.45%) |
28.88 |
28.52 - 29.37 |
0.6002 times |
Thu 04 December 2025 |
28.87 (2.05%) |
28.25 |
28.21 - 28.95 |
0.5628 times |
Wed 03 December 2025 |
28.29 (-0.25%) |
28.46 |
27.67 - 28.65 |
0.8009 times |
Tue 02 December 2025 |
28.36 (-0.6%) |
28.63 |
28.24 - 29.11 |
0.6256 times |
Mon 01 December 2025 |
28.53 (-2.83%) |
29.02 |
28.04 - 29.02 |
0.8403 times |
Fri 28 November 2025 |
29.36 (3.13%) |
28.59 |
27.80 - 29.70 |
0.7425 times |
Wed 26 November 2025 |
28.47 (1.57%) |
29.29 |
28.29 - 30.75 |
1.654 times |
Tue 25 November 2025 |
28.03 (-4.59%) |
25.55 |
24.58 - 31.25 |
2.6963 times |
Mon 24 November 2025 |
29.38 (0.41%) |
29.33 |
29.06 - 30.00 |
0.8492 times |
Fri 21 November 2025 |
29.26 (3.69%) |
28.24 |
28.11 - 30.12 |
0.6282 times |
Thu 20 November 2025 |
28.22 (-5.78%) |
30.67 |
28.00 - 31.00 |
0.8321 times |
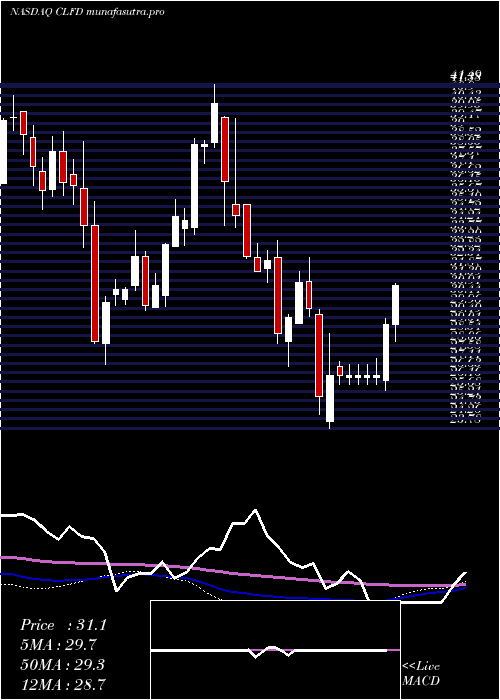
Weekly price and charts ClearfieldInc Strong weekly Stock price targets for ClearfieldInc CLFD are 27.36 and 29.06 | Weekly Target 1 | 26.89 | | Weekly Target 2 | 27.82 | | Weekly Target 3 | 28.593333333333 | | Weekly Target 4 | 29.52 | | Weekly Target 5 | 30.29 |
Weekly price and volumes for Clearfield Inc
| Date |
Closing |
Open |
Range |
Volume |
Fri 05 December 2025 |
28.74 (-2.11%) |
29.02 |
27.67 - 29.37 |
1.1811 times |
Fri 28 November 2025 |
29.36 (0.34%) |
29.33 |
24.58 - 31.25 |
2.0462 times |
Fri 21 November 2025 |
29.26 (-4.75%) |
30.50 |
28.00 - 31.00 |
1.1593 times |
Fri 14 November 2025 |
30.72 (-3.55%) |
32.53 |
30.31 - 33.64 |
0.946 times |
Fri 07 November 2025 |
31.85 (-9.77%) |
33.96 |
31.53 - 34.44 |
0.8482 times |
Fri 31 October 2025 |
35.30 (0%) |
36.34 |
34.75 - 36.70 |
0.2524 times |
Fri 31 October 2025 |
35.30 (-2.54%) |
36.50 |
34.75 - 37.00 |
0.8091 times |
Fri 24 October 2025 |
36.22 (4.8%) |
35.00 |
34.21 - 36.54 |
0.6466 times |
Fri 17 October 2025 |
34.56 (-0.8%) |
35.53 |
34.52 - 37.66 |
1.1052 times |
Fri 10 October 2025 |
34.84 (-2.71%) |
36.07 |
34.73 - 37.24 |
1.0059 times |
Fri 03 October 2025 |
35.81 (6.2%) |
34.07 |
33.55 - 36.07 |
0.8731 times |
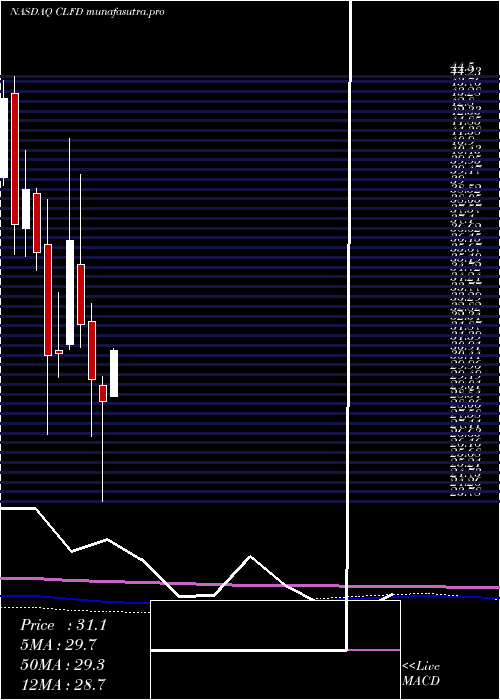
Monthly price and charts ClearfieldInc Strong monthly Stock price targets for ClearfieldInc CLFD are 27.36 and 29.06 | Monthly Target 1 | 26.89 | | Monthly Target 2 | 27.82 | | Monthly Target 3 | 28.593333333333 | | Monthly Target 4 | 29.52 | | Monthly Target 5 | 30.29 |
Monthly price and volumes Clearfield Inc
| Date |
Closing |
Open |
Range |
Volume |
Fri 05 December 2025 |
28.74 (-2.11%) |
29.02 |
27.67 - 29.37 |
0.2074 times |
Fri 28 November 2025 |
29.36 (-16.83%) |
33.96 |
24.58 - 34.44 |
0.8779 times |
Fri 31 October 2025 |
35.30 (2.68%) |
34.07 |
33.85 - 37.66 |
0.7601 times |
Tue 30 September 2025 |
34.38 (5.4%) |
32.10 |
31.42 - 34.83 |
0.9539 times |
Fri 29 August 2025 |
32.62 (-25.54%) |
42.82 |
30.27 - 44.98 |
2.0649 times |
Thu 31 July 2025 |
43.81 (0.92%) |
43.04 |
40.07 - 46.76 |
1.0327 times |
Mon 30 June 2025 |
43.41 (16.98%) |
36.59 |
36.59 - 43.90 |
0.8622 times |
Fri 30 May 2025 |
37.11 (29.44%) |
28.88 |
28.88 - 39.87 |
1.4633 times |
Wed 30 April 2025 |
28.67 (-3.53%) |
29.45 |
23.78 - 29.88 |
0.8155 times |
Mon 31 March 2025 |
29.72 (-8.3%) |
32.56 |
26.94 - 33.42 |
0.9621 times |
Fri 28 February 2025 |
32.41 (-11.18%) |
35.31 |
31.29 - 39.72 |
0.928 times |
DMA SMA EMA moving averages of Clearfield Inc CLFD
DMA (daily moving average) of Clearfield Inc CLFD
| DMA period | DMA value | | 5 day DMA | 28.56 | | 12 day DMA | 28.79 | | 20 day DMA | 29.89 | | 35 day DMA | 32.14 | | 50 day DMA | 33.13 | | 100 day DMA | 34.55 | | 150 day DMA | 36.06 | | 200 day DMA | 34.28 | EMA (exponential moving average) of Clearfield Inc CLFD
| EMA period | EMA current | EMA prev | EMA prev2 | | 5 day EMA | 28.69 | 28.66 | 28.56 | | 12 day EMA | 29.15 | 29.23 | 29.29 | | 20 day EMA | 30 | 30.13 | 30.26 | | 35 day EMA | 31.27 | 31.42 | 31.57 | | 50 day EMA | 32.75 | 32.91 | 33.08 |
SMA (simple moving average) of Clearfield Inc CLFD
| SMA period | SMA current | SMA prev | SMA prev2 | | 5 day SMA | 28.56 | 28.68 | 28.6 | | 12 day SMA | 28.79 | 28.87 | 28.97 | | 20 day SMA | 29.89 | 30.09 | 30.3 | | 35 day SMA | 32.14 | 32.34 | 32.58 | | 50 day SMA | 33.13 | 33.23 | 33.34 | | 100 day SMA | 34.55 | 34.69 | 34.81 | | 150 day SMA | 36.06 | 36.07 | 36.07 | | 200 day SMA | 34.28 | 34.3 | 34.32 |
|
|
