VictorysharesInternational CIL full analysis,charts,indicators,moving averages,SMA,DMA,EMA,ADX,MACD,RSIVictoryshares International CIL WideScreen charts, DMA,SMA,EMA technical analysis, forecast prediction, by indicators ADX,MACD,RSI,CCI NASDAQ stock exchange
operates under N A sector & deals in N A
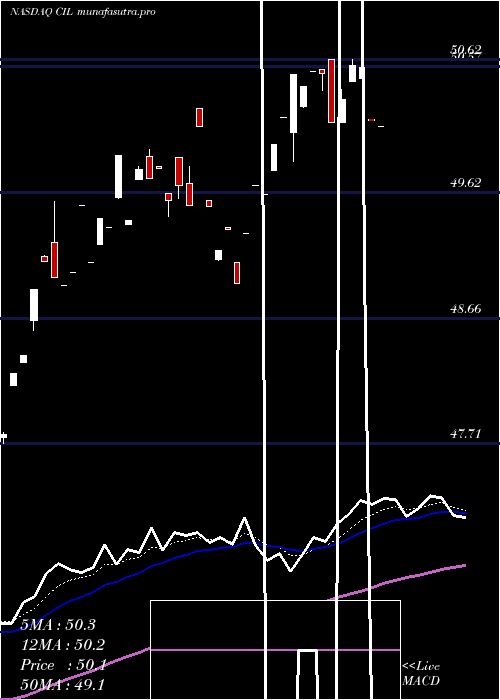
Daily price and charts and targets VictorysharesInternational Strong Daily Stock price targets for VictorysharesInternational CIL are 52.8 and 53.04 | Daily Target 1 | 52.76 | | Daily Target 2 | 52.84 | | Daily Target 3 | 53 | | Daily Target 4 | 53.08 | | Daily Target 5 | 53.24 |
Daily price and volume Victoryshares International
| Date |
Closing |
Open |
Range |
Volume |
Fri 05 December 2025 |
52.92 (0%) |
53.16 |
52.92 - 53.16 |
2.1053 times |
Thu 04 December 2025 |
52.92 (0.17%) |
53.08 |
52.92 - 53.08 |
1.0526 times |
Wed 03 December 2025 |
52.83 (0.3%) |
52.70 |
52.70 - 52.83 |
1.0526 times |
Tue 02 December 2025 |
52.67 (0.19%) |
52.63 |
52.63 - 52.67 |
0.5263 times |
Mon 01 December 2025 |
52.57 (-0.34%) |
52.71 |
52.57 - 52.71 |
1.0526 times |
Fri 28 November 2025 |
52.75 (0.23%) |
52.74 |
52.74 - 52.75 |
0.5263 times |
Wed 26 November 2025 |
52.63 (1.02%) |
52.63 |
52.63 - 52.63 |
0.5263 times |
Tue 25 November 2025 |
52.10 (0.91%) |
51.98 |
51.98 - 52.10 |
0.5263 times |
Mon 24 November 2025 |
51.63 (0.29%) |
51.59 |
51.59 - 51.63 |
0.5263 times |
Fri 21 November 2025 |
51.48 (1.46%) |
51.24 |
51.14 - 51.49 |
2.1053 times |
Thu 20 November 2025 |
50.74 (-1.01%) |
51.65 |
50.74 - 51.65 |
7.3684 times |
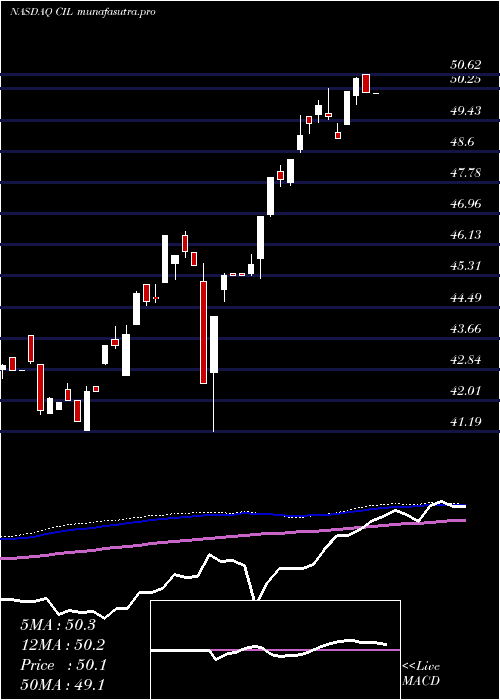
Weekly price and charts VictorysharesInternational Strong weekly Stock price targets for VictorysharesInternational CIL are 52.75 and 53.34 | Weekly Target 1 | 52.29 | | Weekly Target 2 | 52.61 | | Weekly Target 3 | 52.883333333333 | | Weekly Target 4 | 53.2 | | Weekly Target 5 | 53.47 |
Weekly price and volumes for Victoryshares International
| Date |
Closing |
Open |
Range |
Volume |
Fri 05 December 2025 |
52.92 (0.32%) |
52.71 |
52.57 - 53.16 |
0.0217 times |
Fri 28 November 2025 |
52.75 (2.47%) |
51.59 |
51.59 - 52.75 |
0.0079 times |
Fri 21 November 2025 |
51.48 (-2.19%) |
52.40 |
50.74 - 52.40 |
0.0552 times |
Fri 14 November 2025 |
52.63 (1.72%) |
52.39 |
52.39 - 53.24 |
0.0414 times |
Fri 07 November 2025 |
51.74 (-0.17%) |
51.49 |
51.42 - 51.83 |
3.3248 times |
Fri 31 October 2025 |
51.83 (0%) |
51.83 |
51.83 - 51.83 |
0.002 times |
Fri 31 October 2025 |
51.83 (-0.86%) |
52.43 |
51.75 - 52.67 |
3.5336 times |
Fri 24 October 2025 |
52.28 (0.89%) |
52.15 |
51.84 - 52.38 |
2.7851 times |
Fri 17 October 2025 |
51.82 (2.07%) |
51.02 |
50.95 - 51.82 |
0.197 times |
Fri 10 October 2025 |
50.77 (-2.66%) |
52.19 |
50.77 - 52.19 |
0.0315 times |
Fri 03 October 2025 |
52.16 (1.87%) |
51.39 |
51.34 - 52.16 |
0.063 times |
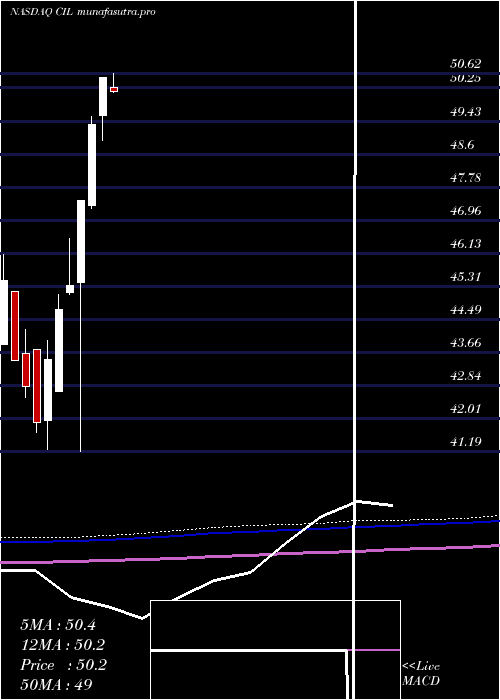
Monthly price and charts VictorysharesInternational Strong monthly Stock price targets for VictorysharesInternational CIL are 52.75 and 53.34 | Monthly Target 1 | 52.29 | | Monthly Target 2 | 52.61 | | Monthly Target 3 | 52.883333333333 | | Monthly Target 4 | 53.2 | | Monthly Target 5 | 53.47 |
Monthly price and volumes Victoryshares International
| Date |
Closing |
Open |
Range |
Volume |
Fri 05 December 2025 |
52.92 (0.32%) |
52.71 |
52.57 - 53.16 |
0.0088 times |
Fri 28 November 2025 |
52.75 (1.78%) |
51.49 |
50.74 - 53.24 |
1.3856 times |
Fri 31 October 2025 |
51.83 (0.45%) |
51.72 |
50.77 - 52.67 |
2.6661 times |
Tue 30 September 2025 |
51.60 (0.49%) |
50.85 |
50.85 - 52.09 |
0.998 times |
Fri 29 August 2025 |
51.35 (3.65%) |
49.54 |
49.54 - 52.16 |
3.8821 times |
Thu 31 July 2025 |
49.54 (-1.92%) |
50.27 |
49.54 - 51.42 |
0.3448 times |
Mon 30 June 2025 |
50.51 (2.35%) |
49.58 |
48.93 - 50.51 |
0.113 times |
Fri 30 May 2025 |
49.35 (4.03%) |
47.32 |
47.24 - 49.55 |
0.1234 times |
Wed 30 April 2025 |
47.44 (4.65%) |
45.39 |
41.19 - 47.44 |
0.3014 times |
Mon 31 March 2025 |
45.33 (1.36%) |
45.14 |
45.09 - 46.49 |
0.1768 times |
Fri 28 February 2025 |
44.72 (2.88%) |
42.67 |
42.67 - 45.09 |
0.2292 times |
DMA SMA EMA moving averages of Victoryshares International CIL
DMA (daily moving average) of Victoryshares International CIL
| DMA period | DMA value | | 5 day DMA | 52.78 | | 12 day DMA | 52.21 | | 20 day DMA | 52.27 | | 35 day DMA | 52.15 | | 50 day DMA | 51.98 | | 100 day DMA | 51.56 | | 150 day DMA | 50.82 | | 200 day DMA | 49.45 | EMA (exponential moving average) of Victoryshares International CIL
| EMA period | EMA current | EMA prev | EMA prev2 | | 5 day EMA | 52.77 | 52.69 | 52.58 | | 12 day EMA | 52.48 | 52.4 | 52.31 | | 20 day EMA | 52.32 | 52.26 | 52.19 | | 35 day EMA | 52.15 | 52.1 | 52.05 | | 50 day EMA | 52.02 | 51.98 | 51.94 |
SMA (simple moving average) of Victoryshares International CIL
| SMA period | SMA current | SMA prev | SMA prev2 | | 5 day SMA | 52.78 | 52.75 | 52.69 | | 12 day SMA | 52.21 | 52.09 | 52.01 | | 20 day SMA | 52.27 | 52.21 | 52.15 | | 35 day SMA | 52.15 | 52.12 | 52.08 | | 50 day SMA | 51.98 | 51.94 | 51.91 | | 100 day SMA | 51.56 | 51.53 | 51.5 | | 150 day SMA | 50.82 | 50.78 | 50.75 | | 200 day SMA | 49.45 | 49.41 | 49.37 |
|
|
