CoherusBiosciences CHRS full analysis,charts,indicators,moving averages,SMA,DMA,EMA,ADX,MACD,RSICoherus Biosciences CHRS WideScreen charts, DMA,SMA,EMA technical analysis, forecast prediction, by indicators ADX,MACD,RSI,CCI NASDAQ stock exchange
operates under Health Care sector & deals in Biotechnology Biological Products No Diagnostic Substances
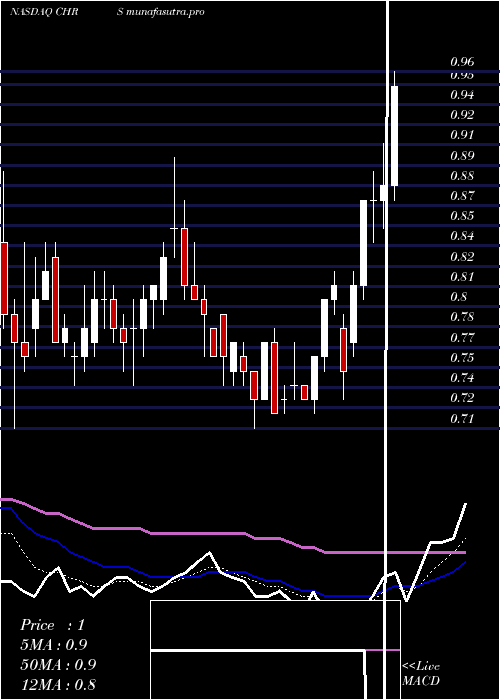
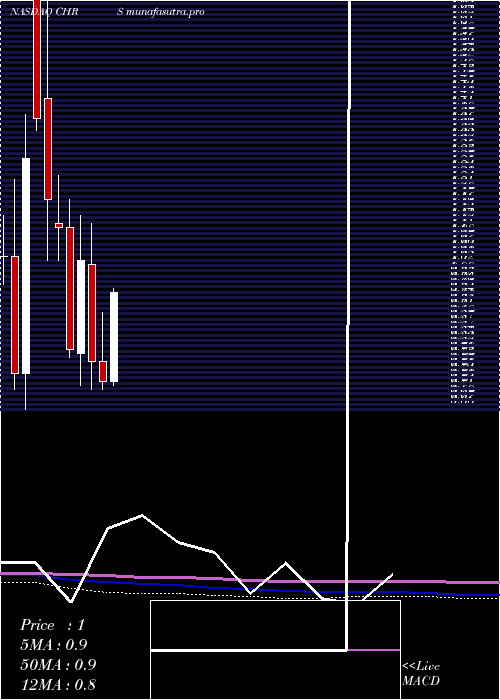
Daily price and charts and targets CoherusBiosciences Strong Daily Stock price targets for CoherusBiosciences CHRS are 1.15 and 1.24 | Daily Target 1 | 1.13 | | Daily Target 2 | 1.16 | | Daily Target 3 | 1.2166666666667 | | Daily Target 4 | 1.25 | | Daily Target 5 | 1.31 |
Daily price and volume Coherus Biosciences
| Date |
Closing |
Open |
Range |
Volume |
Fri 05 December 2025 |
1.20 (-2.44%) |
1.25 |
1.18 - 1.27 |
1.1127 times |
Thu 04 December 2025 |
1.23 (0.82%) |
1.22 |
1.20 - 1.25 |
0.9081 times |
Wed 03 December 2025 |
1.22 (4.27%) |
1.18 |
1.15 - 1.25 |
1.0824 times |
Tue 02 December 2025 |
1.17 (-7.87%) |
1.28 |
1.16 - 1.32 |
0.9121 times |
Mon 01 December 2025 |
1.27 (-6.62%) |
1.31 |
1.26 - 1.33 |
0.8771 times |
Fri 28 November 2025 |
1.36 (3.82%) |
1.34 |
1.33 - 1.39 |
0.8195 times |
Wed 26 November 2025 |
1.31 (2.34%) |
1.27 |
1.25 - 1.32 |
1.0629 times |
Tue 25 November 2025 |
1.28 (0%) |
1.29 |
1.24 - 1.31 |
0.619 times |
Mon 24 November 2025 |
1.28 (10.34%) |
1.15 |
1.15 - 1.30 |
1.6435 times |
Fri 21 November 2025 |
1.16 (5.45%) |
1.09 |
1.09 - 1.17 |
0.9628 times |
Thu 20 November 2025 |
1.10 (-5.17%) |
1.18 |
1.09 - 1.22 |
1.2583 times |
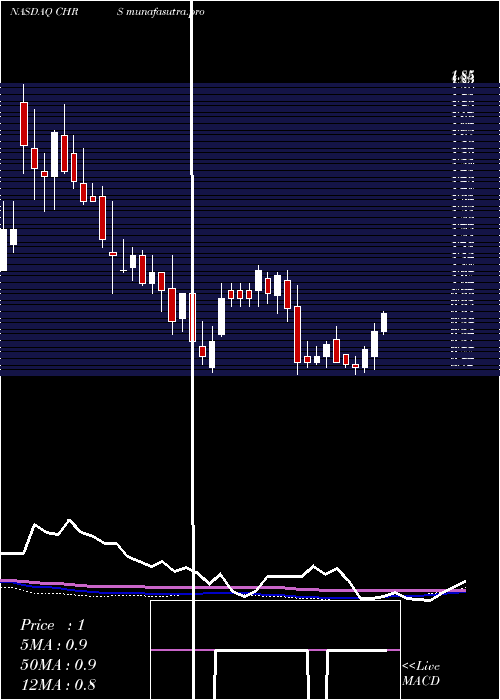
Weekly price and charts CoherusBiosciences Strong weekly Stock price targets for CoherusBiosciences CHRS are 1.09 and 1.27 | Weekly Target 1 | 1.05 | | Weekly Target 2 | 1.12 | | Weekly Target 3 | 1.2266666666667 | | Weekly Target 4 | 1.3 | | Weekly Target 5 | 1.41 |
Weekly price and volumes for Coherus Biosciences
| Date |
Closing |
Open |
Range |
Volume |
Fri 05 December 2025 |
1.20 (-11.76%) |
1.31 |
1.15 - 1.33 |
0.8766 times |
Fri 28 November 2025 |
1.36 (17.24%) |
1.15 |
1.15 - 1.39 |
0.7426 times |
Fri 21 November 2025 |
1.16 (-2.52%) |
1.18 |
1.09 - 1.25 |
1.0949 times |
Fri 14 November 2025 |
1.19 (-11.19%) |
1.37 |
1.09 - 1.43 |
1.7303 times |
Fri 07 November 2025 |
1.34 (-20.24%) |
1.55 |
1.29 - 1.61 |
1.4932 times |
Fri 31 October 2025 |
1.68 (0%) |
1.68 |
1.65 - 1.71 |
0.1515 times |
Fri 31 October 2025 |
1.68 (1.82%) |
1.65 |
1.59 - 1.81 |
1.0559 times |
Fri 24 October 2025 |
1.65 (0%) |
1.66 |
1.62 - 1.82 |
0.6463 times |
Fri 17 October 2025 |
1.65 (-1.2%) |
1.66 |
1.63 - 1.85 |
0.8891 times |
Fri 10 October 2025 |
1.67 (1.83%) |
1.65 |
1.61 - 1.89 |
1.3196 times |
Fri 03 October 2025 |
1.64 (9.33%) |
1.55 |
1.48 - 1.72 |
1.1074 times |
Monthly price and charts CoherusBiosciences Strong monthly Stock price targets for CoherusBiosciences CHRS are 1.09 and 1.27 | Monthly Target 1 | 1.05 | | Monthly Target 2 | 1.12 | | Monthly Target 3 | 1.2266666666667 | | Monthly Target 4 | 1.3 | | Monthly Target 5 | 1.41 |
Monthly price and volumes Coherus Biosciences
| Date |
Closing |
Open |
Range |
Volume |
Fri 05 December 2025 |
1.20 (-11.76%) |
1.31 |
1.15 - 1.33 |
0.1617 times |
Fri 28 November 2025 |
1.36 (-19.05%) |
1.55 |
1.09 - 1.61 |
0.9338 times |
Fri 31 October 2025 |
1.68 (2.44%) |
1.60 |
1.56 - 1.89 |
0.8388 times |
Tue 30 September 2025 |
1.64 (41.38%) |
1.15 |
1.13 - 1.72 |
1.0472 times |
Fri 29 August 2025 |
1.16 (23.4%) |
0.94 |
0.81 - 1.26 |
1.0193 times |
Thu 31 July 2025 |
0.94 (28.77%) |
0.73 |
0.72 - 1.15 |
1.0926 times |
Mon 30 June 2025 |
0.73 (-6.41%) |
0.78 |
0.71 - 0.90 |
0.9145 times |
Fri 30 May 2025 |
0.78 (-24.27%) |
1.02 |
0.71 - 1.12 |
1.1405 times |
Wed 30 April 2025 |
1.03 (27.16%) |
0.80 |
0.72 - 1.14 |
1.3655 times |
Mon 31 March 2025 |
0.81 (-27.03%) |
1.11 |
0.79 - 1.18 |
1.486 times |
Fri 28 February 2025 |
1.11 (-5.93%) |
1.12 |
1.03 - 1.24 |
0.8669 times |
DMA SMA EMA moving averages of Coherus Biosciences CHRS
DMA (daily moving average) of Coherus Biosciences CHRS
| DMA period | DMA value | | 5 day DMA | 1.22 | | 12 day DMA | 1.23 | | 20 day DMA | 1.24 | | 35 day DMA | 1.42 | | 50 day DMA | 1.5 | | 100 day DMA | 1.32 | | 150 day DMA | 1.16 | | 200 day DMA | 1.11 | EMA (exponential moving average) of Coherus Biosciences CHRS
| EMA period | EMA current | EMA prev | EMA prev2 | | 5 day EMA | 1.22 | 1.23 | 1.23 | | 12 day EMA | 1.25 | 1.26 | 1.26 | | 20 day EMA | 1.28 | 1.29 | 1.3 | | 35 day EMA | 1.37 | 1.38 | 1.39 | | 50 day EMA | 1.49 | 1.5 | 1.51 |
SMA (simple moving average) of Coherus Biosciences CHRS
| SMA period | SMA current | SMA prev | SMA prev2 | | 5 day SMA | 1.22 | 1.25 | 1.27 | | 12 day SMA | 1.23 | 1.23 | 1.22 | | 20 day SMA | 1.24 | 1.26 | 1.27 | | 35 day SMA | 1.42 | 1.44 | 1.45 | | 50 day SMA | 1.5 | 1.51 | 1.51 | | 100 day SMA | 1.32 | 1.32 | 1.32 | | 150 day SMA | 1.16 | 1.16 | 1.16 | | 200 day SMA | 1.11 | 1.11 | 1.11 |
|
|
