ChurchillDowns CHDN full analysis,charts,indicators,moving averages,SMA,DMA,EMA,ADX,MACD,RSIChurchill Downs CHDN WideScreen charts, DMA,SMA,EMA technical analysis, forecast prediction, by indicators ADX,MACD,RSI,CCI NASDAQ stock exchange
operates under Consumer Services sector & deals in Services Misc Amusement Recreation
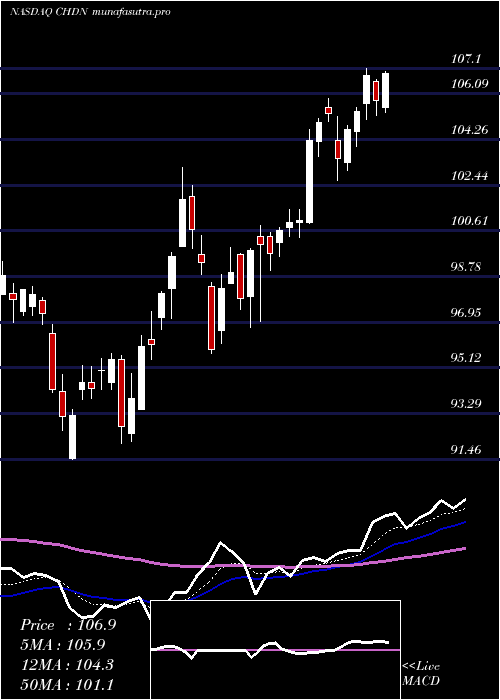
Daily price and charts and targets ChurchillDowns Strong Daily Stock price targets for ChurchillDowns CHDN are 105.63 and 108.38 | Daily Target 1 | 105.15 | | Daily Target 2 | 106.1 | | Daily Target 3 | 107.90333333333 | | Daily Target 4 | 108.85 | | Daily Target 5 | 110.65 |
Daily price and volume Churchill Downs
| Date |
Closing |
Open |
Range |
Volume |
Thu 31 July 2025 |
107.04 (-2.78%) |
109.14 |
106.96 - 109.71 |
0.6505 times |
Wed 30 July 2025 |
110.10 (-0.45%) |
110.91 |
109.68 - 111.64 |
0.5103 times |
Tue 29 July 2025 |
110.60 (-0.58%) |
111.38 |
109.86 - 111.53 |
0.7217 times |
Mon 28 July 2025 |
111.25 (-2.01%) |
113.59 |
110.85 - 113.59 |
0.9282 times |
Fri 25 July 2025 |
113.53 (-0.19%) |
113.93 |
111.64 - 114.28 |
1.3177 times |
Thu 24 July 2025 |
113.75 (4.2%) |
113.50 |
111.71 - 118.46 |
2.5547 times |
Wed 23 July 2025 |
109.16 (1.02%) |
108.36 |
108.12 - 110.00 |
1.1995 times |
Tue 22 July 2025 |
108.06 (2.27%) |
106.12 |
106.12 - 108.27 |
0.7849 times |
Mon 21 July 2025 |
105.66 (0.1%) |
105.97 |
104.84 - 107.17 |
0.7269 times |
Fri 18 July 2025 |
105.55 (-0.68%) |
107.38 |
105.09 - 107.96 |
0.6055 times |
Thu 17 July 2025 |
106.27 (0.82%) |
105.38 |
105.14 - 106.92 |
1.0027 times |
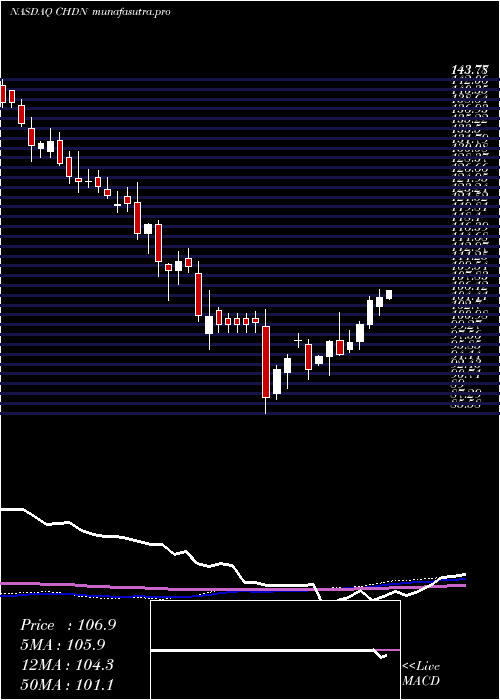
Weekly price and charts ChurchillDowns Strong weekly Stock price targets for ChurchillDowns CHDN are 103.69 and 110.32 | Weekly Target 1 | 102.57 | | Weekly Target 2 | 104.8 | | Weekly Target 3 | 109.19666666667 | | Weekly Target 4 | 111.43 | | Weekly Target 5 | 115.83 |
Weekly price and volumes for Churchill Downs
| Date |
Closing |
Open |
Range |
Volume |
Thu 31 July 2025 |
107.04 (-5.72%) |
113.59 |
106.96 - 113.59 |
0.7246 times |
Fri 25 July 2025 |
113.53 (7.56%) |
105.97 |
104.84 - 118.46 |
1.6971 times |
Fri 18 July 2025 |
105.55 (-0.24%) |
105.53 |
104.15 - 107.96 |
0.9007 times |
Fri 11 July 2025 |
105.80 (0.47%) |
104.21 |
102.62 - 107.10 |
0.7818 times |
Thu 03 July 2025 |
105.30 (4.31%) |
100.95 |
100.35 - 105.89 |
0.5968 times |
Fri 27 June 2025 |
100.95 (3.12%) |
97.99 |
96.73 - 101.47 |
1.0951 times |
Fri 20 June 2025 |
97.90 (2.15%) |
96.61 |
96.10 - 99.92 |
0.6366 times |
Fri 13 June 2025 |
95.84 (-2.28%) |
98.31 |
95.71 - 103.13 |
1.2904 times |
Fri 06 June 2025 |
98.08 (2.73%) |
95.47 |
92.12 - 98.17 |
1.3095 times |
Fri 30 May 2025 |
95.47 (2.39%) |
94.27 |
93.84 - 95.71 |
0.9673 times |
Fri 23 May 2025 |
93.24 (-5.12%) |
97.59 |
91.46 - 98.38 |
1.1439 times |
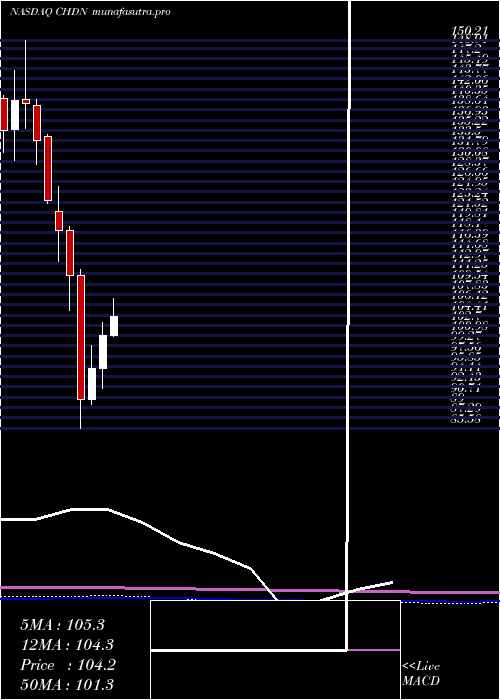
Monthly price and charts ChurchillDowns Strong monthly Stock price targets for ChurchillDowns CHDN are 103.97 and 121.53 | Monthly Target 1 | 91.24 | | Monthly Target 2 | 99.14 | | Monthly Target 3 | 108.8 | | Monthly Target 4 | 116.7 | | Monthly Target 5 | 126.36 |
Monthly price and volumes Churchill Downs
| Date |
Closing |
Open |
Range |
Volume |
Thu 31 July 2025 |
107.04 (5.98%) |
100.93 |
100.90 - 118.46 |
1.1218 times |
Mon 30 June 2025 |
101.00 (5.79%) |
95.47 |
92.12 - 103.13 |
1.1258 times |
Fri 30 May 2025 |
95.47 (5.6%) |
90.33 |
89.43 - 99.38 |
1.4285 times |
Wed 30 April 2025 |
90.41 (-18.6%) |
110.94 |
85.58 - 112.03 |
1.651 times |
Mon 31 March 2025 |
111.07 (-6.27%) |
118.55 |
105.18 - 119.11 |
0.934 times |
Fri 28 February 2025 |
118.50 (-4.11%) |
121.72 |
113.40 - 125.87 |
0.9719 times |
Fri 31 January 2025 |
123.58 (-7.46%) |
134.12 |
122.96 - 134.48 |
0.795 times |
Tue 31 December 2024 |
133.54 (-4.41%) |
139.30 |
129.54 - 140.33 |
0.5116 times |
Tue 26 November 2024 |
139.70 (-0.29%) |
140.30 |
135.59 - 150.21 |
0.6587 times |
Thu 31 October 2024 |
140.10 (3.62%) |
135.35 |
130.10 - 145.26 |
0.8019 times |
Mon 30 September 2024 |
135.21 (-2.71%) |
138.66 |
131.53 - 142.00 |
0.6874 times |
DMA SMA EMA moving averages of Churchill Downs CHDN
DMA (daily moving average) of Churchill Downs CHDN
| DMA period | DMA value | | 5 day DMA | 110.5 | | 12 day DMA | 108.87 | | 20 day DMA | 107.45 | | 35 day DMA | 104.37 | | 50 day DMA | 101.69 | | 100 day DMA | 101.8 | | 150 day DMA | 109.07 | | 200 day DMA | 116.49 | EMA (exponential moving average) of Churchill Downs CHDN
| EMA period | EMA current | EMA prev | EMA prev2 | | 5 day EMA | 109.41 | 110.6 | 110.85 | | 12 day EMA | 108.81 | 109.13 | 108.95 | | 20 day EMA | 107.4 | 107.44 | 107.16 | | 35 day EMA | 104.88 | 104.75 | 104.44 | | 50 day EMA | 102.26 | 102.07 | 101.74 |
SMA (simple moving average) of Churchill Downs CHDN
| SMA period | SMA current | SMA prev | SMA prev2 | | 5 day SMA | 110.5 | 111.85 | 111.66 | | 12 day SMA | 108.87 | 108.63 | 108.36 | | 20 day SMA | 107.45 | 107.34 | 107.05 | | 35 day SMA | 104.37 | 104.16 | 103.82 | | 50 day SMA | 101.69 | 101.52 | 101.27 | | 100 day SMA | 101.8 | 101.85 | 101.88 | | 150 day SMA | 109.07 | 109.24 | 109.38 | | 200 day SMA | 116.49 | 116.65 | 116.78 |
|
|
