CevaInc CEVA full analysis,charts,indicators,moving averages,SMA,DMA,EMA,ADX,MACD,RSICeva Inc CEVA WideScreen charts, DMA,SMA,EMA technical analysis, forecast prediction, by indicators ADX,MACD,RSI,CCI NASDAQ stock exchange
operates under Technology sector & deals in Semiconductors
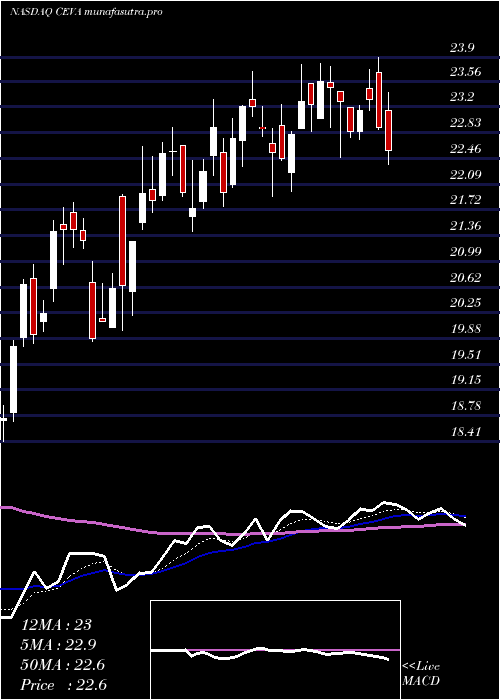
Daily price and charts and targets CevaInc Strong Daily Stock price targets for CevaInc CEVA are 22.87 and 23.47 | Daily Target 1 | 22.43 | | Daily Target 2 | 22.71 | | Daily Target 3 | 23.026666666667 | | Daily Target 4 | 23.31 | | Daily Target 5 | 23.63 |
Daily price and volume Ceva Inc
| Date |
Closing |
Open |
Range |
Volume |
Fri 05 December 2025 |
23.00 (1.19%) |
22.97 |
22.74 - 23.34 |
0.6077 times |
Thu 04 December 2025 |
22.73 (2.99%) |
21.96 |
21.73 - 22.78 |
1.0716 times |
Wed 03 December 2025 |
22.07 (3.62%) |
21.47 |
21.29 - 22.41 |
1.2361 times |
Tue 02 December 2025 |
21.30 (0.52%) |
21.26 |
21.02 - 21.83 |
0.5898 times |
Mon 01 December 2025 |
21.19 (-1.85%) |
21.26 |
21.08 - 21.84 |
0.8472 times |
Fri 28 November 2025 |
21.59 (4.75%) |
20.84 |
20.70 - 21.62 |
0.6967 times |
Wed 26 November 2025 |
20.61 (1.83%) |
20.30 |
20.15 - 20.88 |
0.8731 times |
Tue 25 November 2025 |
20.24 (2.17%) |
19.65 |
19.36 - 20.32 |
0.9978 times |
Mon 24 November 2025 |
19.81 (4.26%) |
19.14 |
19.14 - 20.04 |
1.4286 times |
Fri 21 November 2025 |
19.00 (1.99%) |
18.68 |
18.23 - 19.44 |
1.6514 times |
Thu 20 November 2025 |
18.63 (-1.06%) |
19.35 |
18.31 - 19.61 |
2.076 times |
Weekly price and charts CevaInc Strong weekly Stock price targets for CevaInc CEVA are 22.01 and 24.33 | Weekly Target 1 | 20.13 | | Weekly Target 2 | 21.57 | | Weekly Target 3 | 22.453333333333 | | Weekly Target 4 | 23.89 | | Weekly Target 5 | 24.77 |
Weekly price and volumes for Ceva Inc
| Date |
Closing |
Open |
Range |
Volume |
Fri 05 December 2025 |
23.00 (6.53%) |
21.26 |
21.02 - 23.34 |
1.1646 times |
Fri 28 November 2025 |
21.59 (13.63%) |
19.14 |
19.14 - 21.62 |
1.0693 times |
Fri 21 November 2025 |
19.00 (-22.67%) |
24.58 |
18.23 - 24.81 |
3.8134 times |
Fri 14 November 2025 |
24.57 (-6.08%) |
27.57 |
23.91 - 28.20 |
0.9321 times |
Fri 07 November 2025 |
26.16 (-3.86%) |
26.83 |
25.36 - 27.45 |
0.421 times |
Fri 31 October 2025 |
27.21 (0%) |
27.00 |
26.78 - 27.67 |
0.0986 times |
Fri 31 October 2025 |
27.21 (-3.13%) |
28.50 |
26.78 - 29.20 |
0.5484 times |
Fri 24 October 2025 |
28.09 (5.44%) |
27.40 |
25.44 - 28.33 |
0.453 times |
Fri 17 October 2025 |
26.64 (-1%) |
28.45 |
26.63 - 30.75 |
0.7452 times |
Fri 10 October 2025 |
26.91 (-3.96%) |
28.55 |
26.82 - 30.88 |
0.7544 times |
Fri 03 October 2025 |
28.02 (6.54%) |
26.54 |
25.42 - 28.87 |
0.6803 times |

Monthly price and charts CevaInc Strong monthly Stock price targets for CevaInc CEVA are 22.01 and 24.33 | Monthly Target 1 | 20.13 | | Monthly Target 2 | 21.57 | | Monthly Target 3 | 22.453333333333 | | Monthly Target 4 | 23.89 | | Monthly Target 5 | 24.77 |
Monthly price and volumes Ceva Inc
| Date |
Closing |
Open |
Range |
Volume |
Fri 05 December 2025 |
23.00 (6.53%) |
21.26 |
21.02 - 23.34 |
0.3944 times |
Fri 28 November 2025 |
21.59 (-20.65%) |
26.83 |
18.23 - 28.20 |
2.1119 times |
Fri 31 October 2025 |
27.21 (3.03%) |
26.01 |
25.44 - 30.88 |
1.013 times |
Tue 30 September 2025 |
26.41 (18.86%) |
21.40 |
21.31 - 27.76 |
1.1445 times |
Fri 29 August 2025 |
22.22 (3.98%) |
20.98 |
20.41 - 24.56 |
0.9476 times |
Thu 31 July 2025 |
21.37 (-2.78%) |
21.63 |
21.30 - 23.90 |
0.8235 times |
Mon 30 June 2025 |
21.98 (17.16%) |
18.71 |
18.41 - 22.90 |
0.8784 times |
Fri 30 May 2025 |
18.76 (-28.42%) |
26.46 |
18.31 - 27.52 |
1.1945 times |
Wed 30 April 2025 |
26.21 (2.34%) |
25.38 |
19.35 - 27.19 |
0.7475 times |
Mon 31 March 2025 |
25.61 (-25.25%) |
34.45 |
24.65 - 34.68 |
0.7448 times |
Fri 28 February 2025 |
34.26 (6.36%) |
31.29 |
30.82 - 38.94 |
1.0663 times |

DMA SMA EMA moving averages of Ceva Inc CEVA
DMA (daily moving average) of Ceva Inc CEVA
| DMA period | DMA value | | 5 day DMA | 22.06 | | 12 day DMA | 20.75 | | 20 day DMA | 22.39 | | 35 day DMA | 24.49 | | 50 day DMA | 25.58 | | 100 day DMA | 24.43 | | 150 day DMA | 23.45 | | 200 day DMA | 24.46 | EMA (exponential moving average) of Ceva Inc CEVA
| EMA period | EMA current | EMA prev | EMA prev2 | | 5 day EMA | 22.21 | 21.82 | 21.37 | | 12 day EMA | 21.97 | 21.78 | 21.61 | | 20 day EMA | 22.57 | 22.53 | 22.51 | | 35 day EMA | 23.76 | 23.81 | 23.87 | | 50 day EMA | 25.31 | 25.4 | 25.51 |
SMA (simple moving average) of Ceva Inc CEVA
| SMA period | SMA current | SMA prev | SMA prev2 | | 5 day SMA | 22.06 | 21.78 | 21.35 | | 12 day SMA | 20.75 | 20.51 | 20.58 | | 20 day SMA | 22.39 | 22.58 | 22.8 | | 35 day SMA | 24.49 | 24.65 | 24.84 | | 50 day SMA | 25.58 | 25.65 | 25.72 | | 100 day SMA | 24.43 | 24.43 | 24.42 | | 150 day SMA | 23.45 | 23.47 | 23.5 | | 200 day SMA | 24.46 | 24.52 | 24.59 |
|
|
