CassInformation CASS full analysis,charts,indicators,moving averages,SMA,DMA,EMA,ADX,MACD,RSICass Information CASS WideScreen charts, DMA,SMA,EMA technical analysis, forecast prediction, by indicators ADX,MACD,RSI,CCI NASDAQ stock exchange
operates under Miscellaneous sector & deals in Business Services
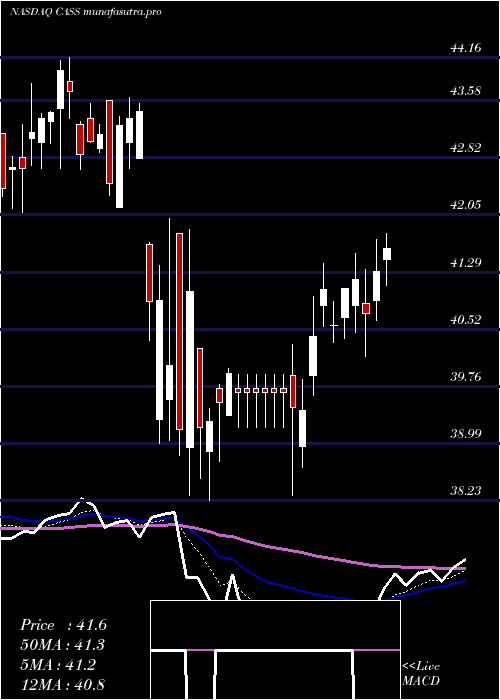
Daily price and charts and targets CassInformation Strong Daily Stock price targets for CassInformation CASS are 42.91 and 43.49 | Daily Target 1 | 42.44 | | Daily Target 2 | 42.79 | | Daily Target 3 | 43.023333333333 | | Daily Target 4 | 43.37 | | Daily Target 5 | 43.6 |
Daily price and volume Cass Information
| Date |
Closing |
Open |
Range |
Volume |
Fri 05 December 2025 |
43.13 (-0.16%) |
42.99 |
42.68 - 43.26 |
0.6003 times |
Thu 04 December 2025 |
43.20 (-0.92%) |
43.39 |
43.04 - 43.68 |
0.6485 times |
Wed 03 December 2025 |
43.60 (2.64%) |
42.57 |
42.57 - 43.67 |
0.6467 times |
Tue 02 December 2025 |
42.48 (-0.49%) |
42.84 |
42.44 - 43.12 |
0.6115 times |
Mon 01 December 2025 |
42.69 (1.64%) |
41.61 |
40.52 - 42.71 |
0.8292 times |
Fri 28 November 2025 |
42.00 (0.05%) |
41.91 |
41.70 - 42.10 |
0.3696 times |
Wed 26 November 2025 |
41.98 (-0.05%) |
41.97 |
41.38 - 42.47 |
0.8384 times |
Tue 25 November 2025 |
42.00 (1.62%) |
41.57 |
40.50 - 42.23 |
1.1117 times |
Mon 24 November 2025 |
41.33 (-0.65%) |
41.46 |
40.50 - 41.79 |
3.4121 times |
Fri 21 November 2025 |
41.60 (3.64%) |
40.24 |
40.12 - 41.60 |
0.932 times |
Thu 20 November 2025 |
40.14 (0.25%) |
40.58 |
39.83 - 40.78 |
0.668 times |
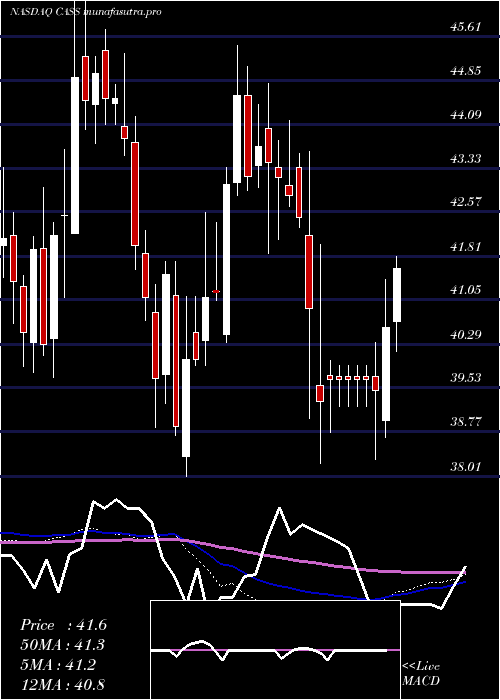
Weekly price and charts CassInformation Strong weekly Stock price targets for CassInformation CASS are 41.83 and 44.99 | Weekly Target 1 | 39.28 | | Weekly Target 2 | 41.21 | | Weekly Target 3 | 42.443333333333 | | Weekly Target 4 | 44.37 | | Weekly Target 5 | 45.6 |
Weekly price and volumes for Cass Information
| Date |
Closing |
Open |
Range |
Volume |
Fri 05 December 2025 |
43.13 (2.69%) |
41.61 |
40.52 - 43.68 |
0.7563 times |
Fri 28 November 2025 |
42.00 (0.96%) |
41.46 |
40.50 - 42.47 |
1.2995 times |
Fri 21 November 2025 |
41.60 (0.75%) |
41.05 |
39.83 - 41.60 |
0.988 times |
Fri 14 November 2025 |
41.29 (4.4%) |
40.20 |
40.01 - 42.07 |
0.929 times |
Fri 07 November 2025 |
39.55 (0.05%) |
39.16 |
38.61 - 40.44 |
0.6566 times |
Fri 31 October 2025 |
39.53 (0%) |
39.23 |
38.43 - 40.07 |
0.6041 times |
Fri 31 October 2025 |
39.53 (1.23%) |
39.15 |
38.43 - 40.13 |
1.5055 times |
Fri 24 October 2025 |
39.05 (5%) |
37.31 |
37.27 - 39.92 |
1.1674 times |
Fri 17 October 2025 |
37.19 (0.46%) |
37.40 |
36.07 - 37.90 |
1.4684 times |
Fri 10 October 2025 |
37.02 (-6.25%) |
39.51 |
36.93 - 39.91 |
0.6253 times |
Fri 03 October 2025 |
39.49 (-2.23%) |
40.42 |
38.51 - 40.42 |
0.4475 times |
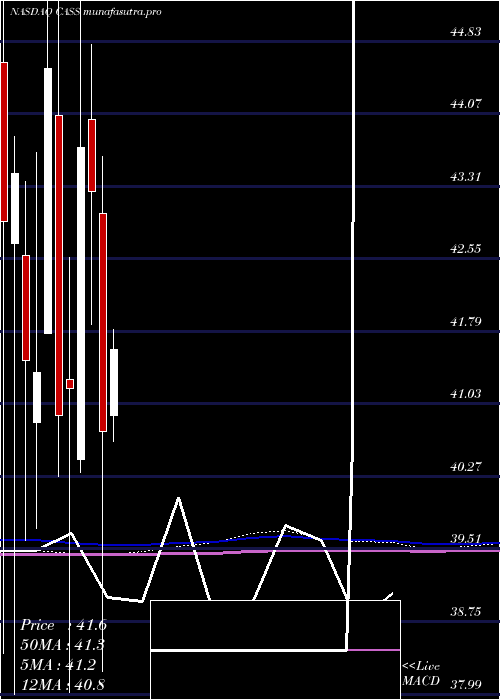
Monthly price and charts CassInformation Strong monthly Stock price targets for CassInformation CASS are 41.83 and 44.99 | Monthly Target 1 | 39.28 | | Monthly Target 2 | 41.21 | | Monthly Target 3 | 42.443333333333 | | Monthly Target 4 | 44.37 | | Monthly Target 5 | 45.6 |
Monthly price and volumes Cass Information
| Date |
Closing |
Open |
Range |
Volume |
Fri 05 December 2025 |
43.13 (2.69%) |
41.61 |
40.52 - 43.68 |
0.2854 times |
Fri 28 November 2025 |
42.00 (6.25%) |
39.16 |
38.61 - 42.47 |
1.4616 times |
Fri 31 October 2025 |
39.53 (0.51%) |
39.13 |
36.07 - 40.13 |
2.1265 times |
Tue 30 September 2025 |
39.33 (-8.79%) |
42.75 |
39.05 - 44.06 |
0.8163 times |
Fri 29 August 2025 |
43.12 (7.77%) |
39.63 |
38.89 - 43.68 |
1.0225 times |
Thu 31 July 2025 |
40.01 (-7.92%) |
43.44 |
39.56 - 47.00 |
1.158 times |
Mon 30 June 2025 |
43.45 (2.72%) |
42.52 |
40.98 - 44.59 |
0.8417 times |
Fri 30 May 2025 |
42.30 (3.83%) |
40.91 |
40.64 - 43.94 |
0.8081 times |
Wed 30 April 2025 |
40.74 (-5.8%) |
43.02 |
38.23 - 43.62 |
0.8925 times |
Mon 31 March 2025 |
43.25 (-1.05%) |
44.01 |
41.86 - 44.79 |
0.5876 times |
Fri 28 February 2025 |
43.71 (6.12%) |
40.45 |
40.31 - 45.45 |
0.6805 times |
DMA SMA EMA moving averages of Cass Information CASS
DMA (daily moving average) of Cass Information CASS
| DMA period | DMA value | | 5 day DMA | 43.02 | | 12 day DMA | 42.02 | | 20 day DMA | 41.63 | | 35 day DMA | 40.55 | | 50 day DMA | 39.91 | | 100 day DMA | 41.11 | | 150 day DMA | 41.75 | | 200 day DMA | 41.75 | EMA (exponential moving average) of Cass Information CASS
| EMA period | EMA current | EMA prev | EMA prev2 | | 5 day EMA | 42.93 | 42.83 | 42.65 | | 12 day EMA | 42.28 | 42.12 | 41.92 | | 20 day EMA | 41.73 | 41.58 | 41.41 | | 35 day EMA | 41.01 | 40.89 | 40.75 | | 50 day EMA | 40.31 | 40.19 | 40.07 |
SMA (simple moving average) of Cass Information CASS
| SMA period | SMA current | SMA prev | SMA prev2 | | 5 day SMA | 43.02 | 42.79 | 42.55 | | 12 day SMA | 42.02 | 41.79 | 41.6 | | 20 day SMA | 41.63 | 41.47 | 41.33 | | 35 day SMA | 40.55 | 40.37 | 40.19 | | 50 day SMA | 39.91 | 39.85 | 39.8 | | 100 day SMA | 41.11 | 41.13 | 41.14 | | 150 day SMA | 41.75 | 41.74 | 41.72 | | 200 day SMA | 41.75 | 41.75 | 41.76 |
|
|
