CapniaInc CAPN full analysis,charts,indicators,moving averages,SMA,DMA,EMA,ADX,MACD,RSICapnia Inc CAPN WideScreen charts, DMA,SMA,EMA technical analysis, forecast prediction, by indicators ADX,MACD,RSI,CCI NASDAQ stock exchange
operates under Health Care sector & deals in Biotechnology: Electromedical & Electrotherapeutic Apparatus
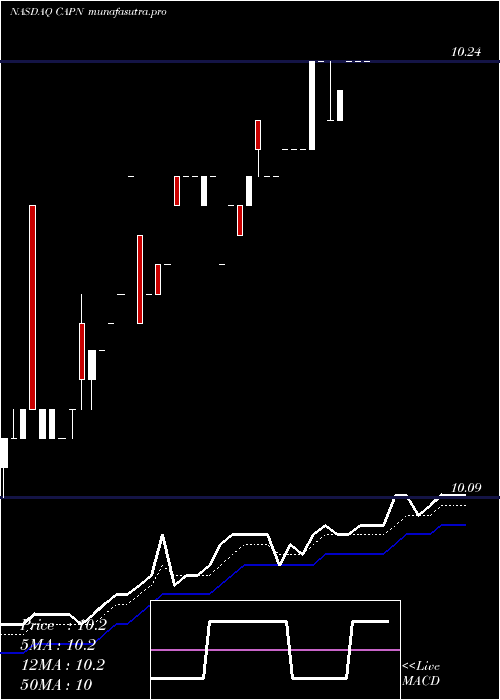
Daily price and charts and targets CapniaInc Strong Daily Stock price targets for CapniaInc CAPN are 10.24 and 10.24 | Daily Target 1 | 10.24 | | Daily Target 2 | 10.24 | | Daily Target 3 | 10.24 | | Daily Target 4 | 10.24 | | Daily Target 5 | 10.24 |
Daily price and volume Capnia Inc
| Date |
Closing |
Open |
Range |
Volume |
Thu 22 May 2025 |
10.24 (0%) |
10.24 |
10.24 - 10.24 |
0.531 times |
Tue 20 May 2025 |
10.24 (0%) |
10.24 |
10.24 - 10.24 |
0.177 times |
Mon 19 May 2025 |
10.24 (0.1%) |
10.24 |
10.24 - 10.24 |
1.3274 times |
Fri 16 May 2025 |
10.23 (0.1%) |
10.22 |
10.22 - 10.23 |
4.4248 times |
Tue 13 May 2025 |
10.22 (-0.2%) |
10.22 |
10.22 - 10.24 |
2.3894 times |
Thu 08 May 2025 |
10.24 (0%) |
10.24 |
10.24 - 10.24 |
0.0885 times |
Tue 06 May 2025 |
10.24 (0.29%) |
10.21 |
10.21 - 10.24 |
0.6195 times |
Mon 05 May 2025 |
10.21 (0%) |
10.21 |
10.21 - 10.21 |
0.177 times |
Fri 02 May 2025 |
10.21 (0%) |
10.21 |
10.21 - 10.21 |
0.0885 times |
Thu 01 May 2025 |
10.21 (0.1%) |
10.21 |
10.21 - 10.21 |
0.177 times |
Wed 30 April 2025 |
10.20 (0%) |
10.20 |
10.20 - 10.20 |
0.0885 times |
Weekly price and charts CapniaInc Strong weekly Stock price targets for CapniaInc CAPN are 10.24 and 10.24 | Weekly Target 1 | 10.24 | | Weekly Target 2 | 10.24 | | Weekly Target 3 | 10.24 | | Weekly Target 4 | 10.24 | | Weekly Target 5 | 10.24 |
Weekly price and volumes for Capnia Inc
| Date |
Closing |
Open |
Range |
Volume |
Thu 22 May 2025 |
10.24 (0.1%) |
10.24 |
10.24 - 10.24 |
0.4894 times |
Fri 16 May 2025 |
10.23 (-0.1%) |
10.22 |
10.22 - 10.24 |
1.6383 times |
Thu 08 May 2025 |
10.24 (0.29%) |
10.21 |
10.21 - 10.24 |
0.2128 times |
Fri 02 May 2025 |
10.21 (0.1%) |
10.22 |
10.20 - 10.22 |
2.0851 times |
Fri 25 April 2025 |
10.20 (0%) |
10.17 |
10.17 - 10.20 |
0.3191 times |
Wed 16 April 2025 |
10.20 (0%) |
10.20 |
10.20 - 10.20 |
0 times |
Wed 16 April 2025 |
10.20 (0%) |
10.19 |
10.19 - 10.20 |
1.0638 times |
Wed 16 April 2025 |
10.20 (0%) |
10.20 |
10.20 - 10.20 |
0 times |
Wed 16 April 2025 |
10.20 (0.1%) |
10.20 |
10.20 - 10.20 |
0 times |
Fri 11 April 2025 |
10.19 (0.39%) |
10.16 |
10.16 - 10.20 |
4.1915 times |
Thu 03 April 2025 |
10.15 (-0.1%) |
10.20 |
10.15 - 10.20 |
0.6809 times |
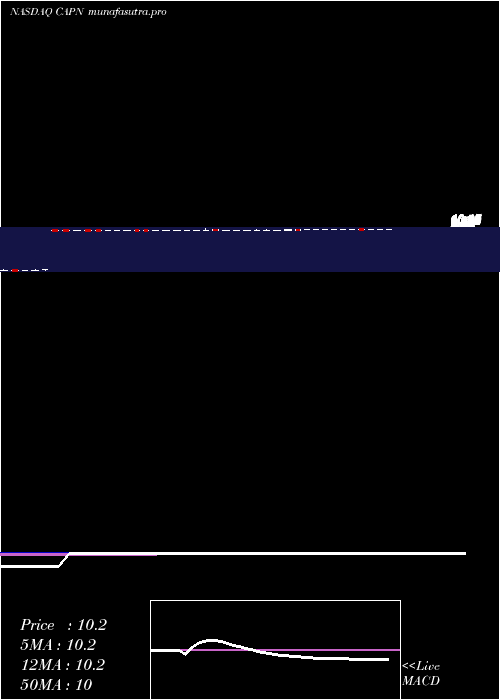
Monthly price and charts CapniaInc Strong monthly Stock price targets for CapniaInc CAPN are 10.23 and 10.26 | Monthly Target 1 | 10.2 | | Monthly Target 2 | 10.22 | | Monthly Target 3 | 10.23 | | Monthly Target 4 | 10.25 | | Monthly Target 5 | 10.26 |
Monthly price and volumes Capnia Inc
| Date |
Closing |
Open |
Range |
Volume |
Thu 22 May 2025 |
10.24 (0.39%) |
10.21 |
10.21 - 10.24 |
0.0248 times |
Wed 30 April 2025 |
10.20 (0%) |
10.18 |
10.15 - 10.22 |
0.0816 times |
Mon 31 March 2025 |
10.20 (0.79%) |
10.11 |
10.11 - 10.20 |
1.0097 times |
Fri 28 February 2025 |
10.12 (0.7%) |
10.08 |
10.06 - 10.19 |
1.1448 times |
Wed 29 January 2025 |
10.05 (0%) |
10.03 |
10.02 - 10.47 |
1.4024 times |
Tue 31 December 2024 |
10.05 (0.6%) |
10.00 |
9.98 - 10.10 |
0.4116 times |
Tue 26 November 2024 |
9.99 (0.2%) |
9.97 |
9.96 - 10.14 |
1.2262 times |
Thu 31 October 2024 |
9.97 (1324.29%) |
9.97 |
9.95 - 10.05 |
2.4747 times |
Thu 11 May 2017 |
0.70 (16.67%) |
0.58 |
0.55 - 0.72 |
0.3379 times |
Fri 28 April 2017 |
0.60 (-15.49%) |
0.70 |
0.55 - 0.71 |
1.8863 times |
Fri 31 March 2017 |
0.71 (9.23%) |
0.68 |
0.59 - 0.82 |
3.8093 times |

DMA SMA EMA moving averages of Capnia Inc CAPN
DMA (daily moving average) of Capnia Inc CAPN
| DMA period | DMA value | | 5 day DMA | 10.23 | | 12 day DMA | 10.22 | | 20 day DMA | 10.21 | | 35 day DMA | 10.19 | | 50 day DMA | 10.16 | | 100 day DMA | 9.9 | | 150 day DMA | 6.82 | | 200 day DMA | 5.32 | EMA (exponential moving average) of Capnia Inc CAPN
| EMA period | EMA current | EMA prev | EMA prev2 | | 5 day EMA | 10.23 | 10.23 | 10.23 | | 12 day EMA | 10.21 | 10.21 | 10.21 | | 20 day EMA | 10.19 | 10.19 | 10.19 | | 35 day EMA | 10.16 | 10.16 | 10.16 | | 50 day EMA | 10.15 | 10.15 | 10.15 |
SMA (simple moving average) of Capnia Inc CAPN
| SMA period | SMA current | SMA prev | SMA prev2 | | 5 day SMA | 10.23 | 10.23 | 10.23 | | 12 day SMA | 10.22 | 10.22 | 10.22 | | 20 day SMA | 10.21 | 10.21 | 10.21 | | 35 day SMA | 10.19 | 10.18 | 10.18 | | 50 day SMA | 10.16 | 10.16 | 10.16 | | 100 day SMA | 9.9 | 9.8 | 9.71 | | 150 day SMA | 6.82 | 6.76 | 6.69 | | 200 day SMA | 5.32 | 5.27 | 5.23 |
|
|
